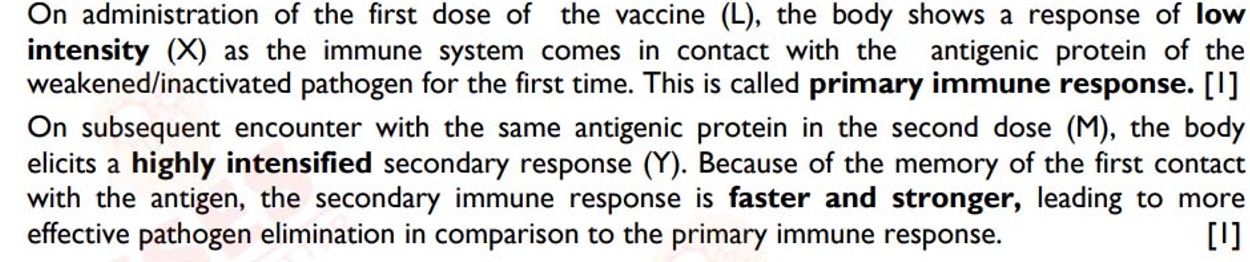
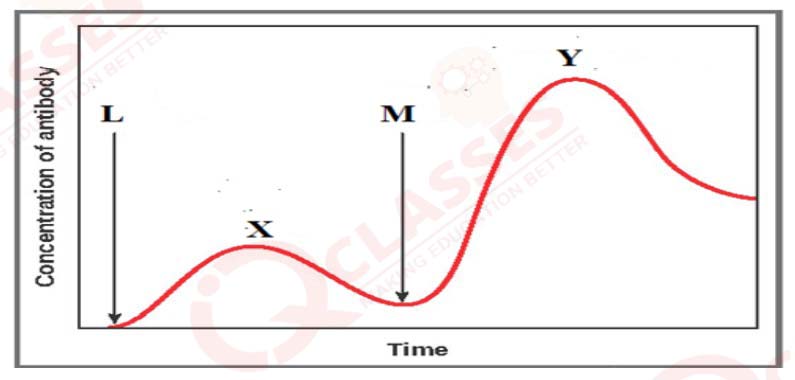
The graph given below indicates the administration of the first (L) and second dose (M) of a vaccine. The corresponding response of the body is indicated by X and Y. Interpret the graph and explain the reason for such a response shown by the body.
Solution