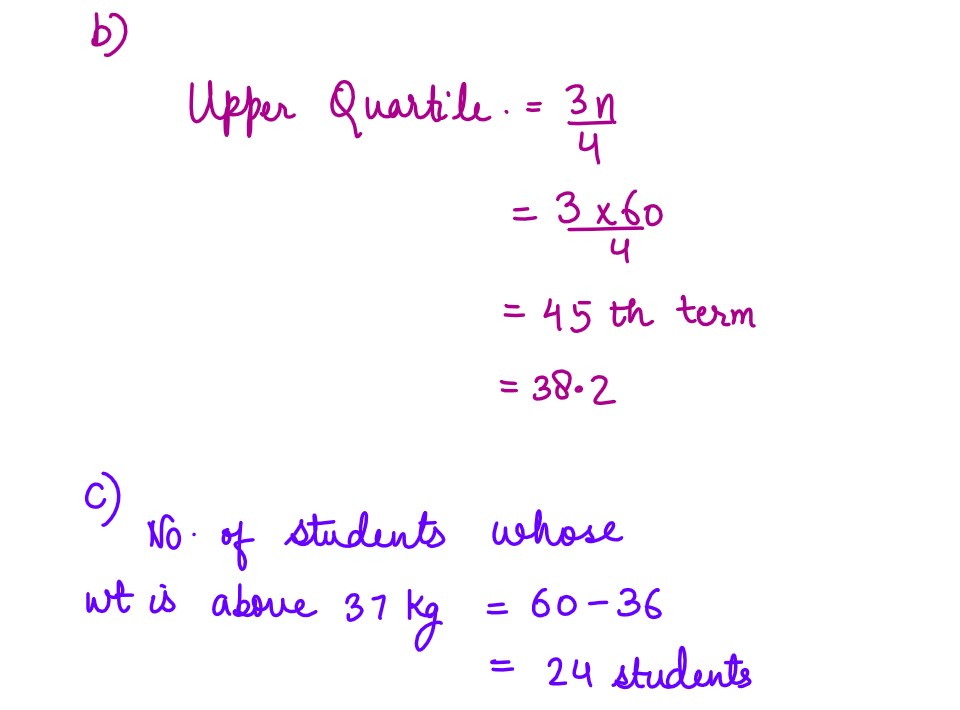
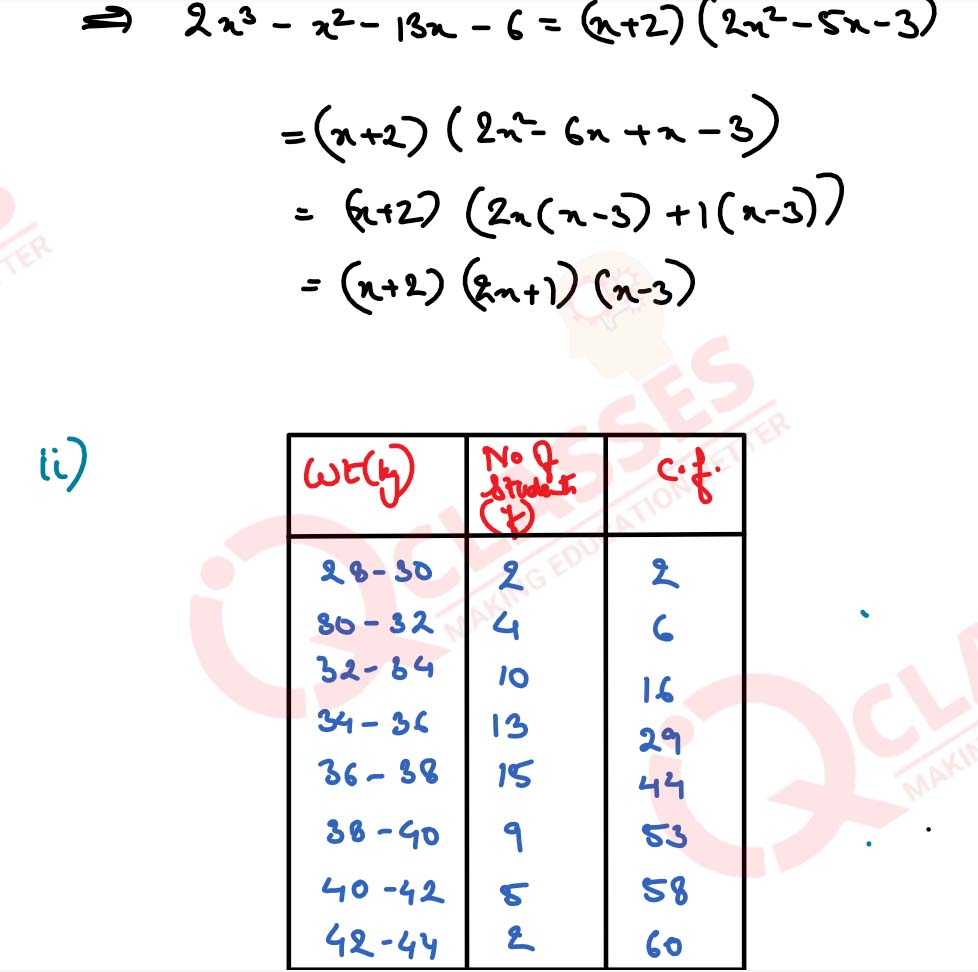
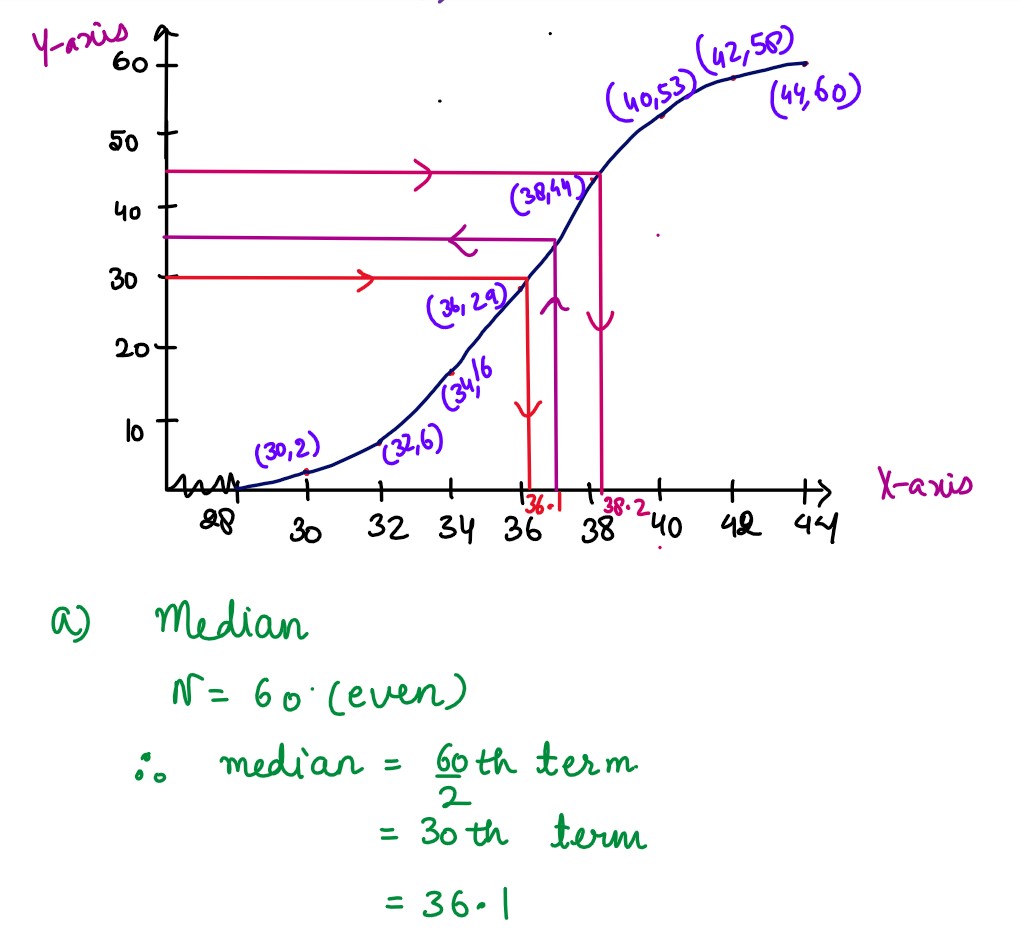
(ii) Use graph paper to answer this question. During a medical checkup of 60 students in a school, weights were recorded as follows: Taking 2 cm = 2 kg along one axis and 2 cm = 10 students along the other axis draw an ogive. Use your graph to find the: (a) median (b) upper Quartile (c) number of students whose weight is above 37 kg

 ,
, ,
, ,
, ,
,