(i) The given graph with a histogram represents the number of plants of different heigh grown in a school campus. Study the graph carefully and answer the following questions
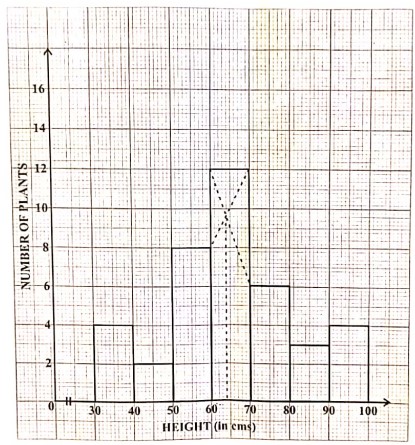
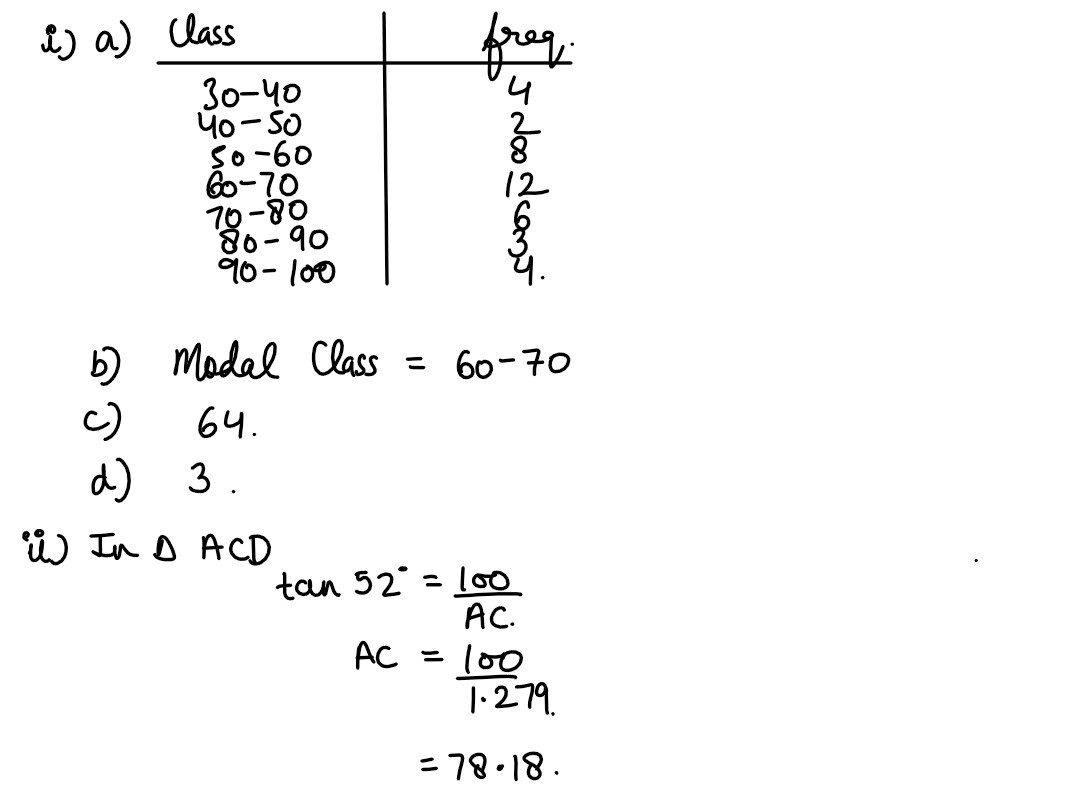
(a) Make a frequency table with respect to the class boundaries and their corresponding frequencies.
(b) State the modal class.
(c) Identify and note down the mode of the distribution.
(d) Find the number of plants whose height range is between 80 cm to 90 cm.
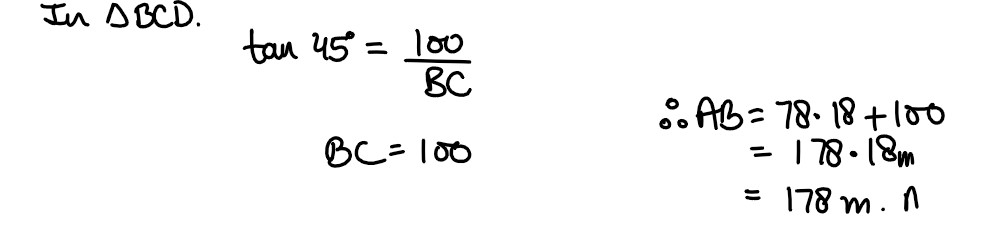
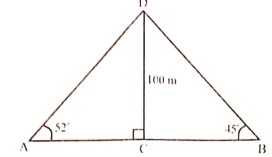
(ii) The angle of elevation of the top of a 100 m high tree from two points A and B on the opposite side of the tree are 52° and 45° respectively.Find the distance AB to the nearest meter.
Solution
 ,
,