Class XII ISC Maths Chapter Linear Regression Exercise 2
Discover a wide range of Linear Regression practice questions designed to help you master this fundamental topic in statistics and data analysis. Our carefully curated questions cover key aspects of Linear Regression, including understanding relationships between variables, calculating best-fit lines, and interpreting regression coefficients. Perfect for students, professionals, and anyone looking to deepen their understanding of predictive modeling, these questions offer a comprehensive way to practice and apply Linear Regression concepts in real-world scenarios. Whether you're preparing for exams or enhancing your analytical skills, our collection is an invaluable resource.
class 12 ITF exercise2-1
Linear Regression
Select Exercise
Q1 If the two lines of regression are 3x - 2y + 1 = 0 and 2x - y - 2 = 0, find x̄ and ȳ
Q2 If the two coefficients of regression are - 0.6 and - 1.4, find the coefficient of correlation.
Q3 Find the regression coefficient of y on x for the following data: ∑x = 60, ∑y = 105, ∑x2 = 800, ∑y2 = 2000, ∑xy = 1200 and n = 10.
Q4 x and y are correlated variables. Ten observations of values of (x, y) have the following results : ∑x = 55, ∑y = 55, ∑xy = 350, ∑x2 = 385 Predict the value of y when the value of x is 6.
Q5 The following results were obtained with respect to two variables x and y : ∑x = 30, ∑y = 42, ∑xy = 199, ∑x2 = 184, ∑x2 = 318, n = 6, Find the following :
(i) the regression coefficients.
(ii) correlation coefficient between x and y.
(iii) the regression equation of y on x.
(iv) the likely value of y when x = 10.
Q6 (i) Out of the two regression lines, find the line of regression of Y on X : 3x + 12y = 8, 9x + 3y = 46
(ii) Two regression lines are represented by 2x + 3y—10 = 0 and 4x + y —5 =0. Find the line of regression of y on x.
(iii) Two regression lines are represented by 4x + 10y = 9 and 6x + 3y = 4. Find the regression line of y on x.
Q7 Find the coefficient of correlation from the following regression lines
(i) x - 2y + 3 = 0 , 4x - 5y + 1 = 0
(ii) 3x + 4y - 7 = 0, 4x + y - 5 = 0.
Q8 If x̄ = 18, ȳ = 100, σx = 14, σy = 20 and ρ(X, Y) = 0.8 find the regression lines. Estimate the value of y when x = 70 and that of x when y = 90
Q10 The following table shows the mean and standard deviation of the marks of Mathematics and Physics scored by the students of a school:
Q11 There are two series of index numbers : P for price index and S for stock of a commodity. The mean and standard deviation of P are 100 and 8 and of S are 103 and 4 respectively. The correlation coefficient between the two series is 0.4. With these data, obtain the regression lines of P on S and S on P.
Q12 The line of regression of marks in statistics (X) on marks in accountancy (Y) for a class of 50 students is 3Y — 5X + 180 = 0.
Average score in accountancy is 44 and variance of marks in statistics is 9 / 16 th of variance of marks in accountancy. Find the average score in statistics and also the coefficient of correlation between marks in statistics and accountancy.
Q13 From the equations of the two regression lines, 4x + 3y +7 =0 and 3x + 4y + 8 =0, find:
(i) the means of x and y.
(ii) the regression coefficients.
(iii) the coefficient of correlation.
Q14 Two random variables have regression lines 3x + 2y - 26 = 0 and 6x + y-31 = 0. Calculate:
(i) the mean values of x and y
(ii) the coefficient of determination
(iii) the standard deviation of y, given variance of x is 25,
Q15 Show that if five students get respectively 1, 2, 3, 4, 5 marks (X) out of 10 in subject A,and 3, 3, 5, 7, 6 marks (Y) out of 10 in subject B, the regression equation of Y on X can be written as y = 1.8 + x.
Q17 Treating x as independent variable, find the line of best fit for the following data :
Q19 A manufacturer of optical lenses has the following data on the cost per unit (in ₹) of a certain quality of lens and the number of units made in each order:
Q20 The following observations are given : (1, 4), (2, 8), (3, 2), (4, 12), (5, 10), (6, 14), (7, 16), (8, 6), (9, 18) Estimate the values of y when the value of x is 10 and also estimate the value of x when the value of y is 5.
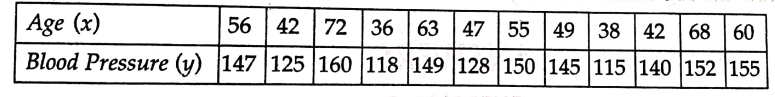
Q21 The following table shows the ages x and systolic blood pressure y of 12 women.
(i) Find the correlation coefficient between x and y.
(ii) Determine the least squares regression line of y on x.
(iii) Estimate the blood pressure of a woman whose age is 45 years.


Add a comment