Measures of Central Tendency Chapter Board Questions class10 ICSE
Here we provide Class 10 Maths important notes,board questions and predicted questions with Answers for chapter Measures of Central Tendency. These important notes,board questions and predicted questions are based on ICSE board curriculum and correspond to the most recent Class 10 Maths syllabus. By practising these Class 10 materials, students will be able to quickly review all of the ideas covered in the chapter and prepare for the Class 10 Board examinations.
Class 10 ICSE Measures of Central Tendency Boards Questions
Measures of Central Tendency Boards Questions
2016
Q1
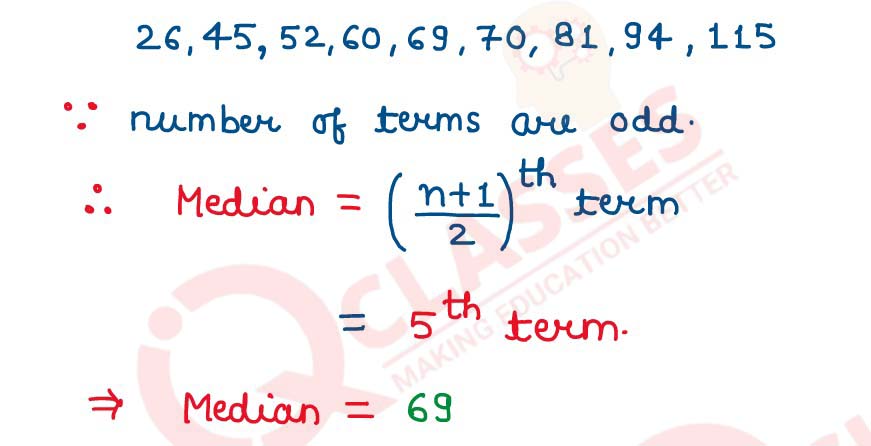
The mean of following numbers is 68. Find the value of 'x'. 45, 52, 60, x, 69, 70, 26, 81 and 94
Hence estimate the median.
solutions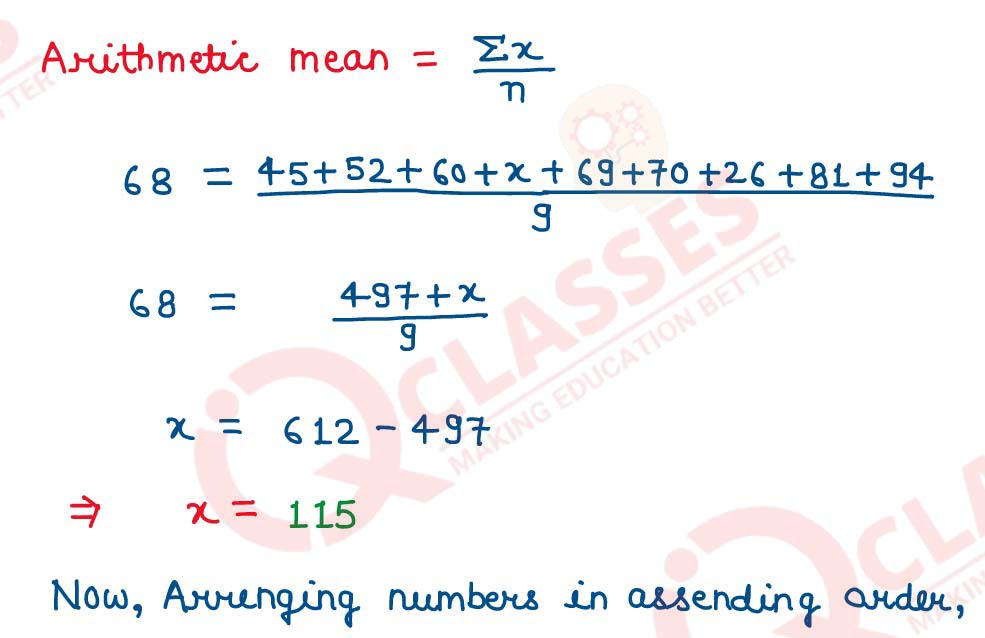
solutions
Q2
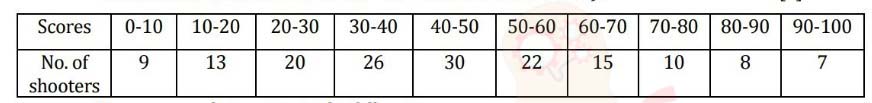
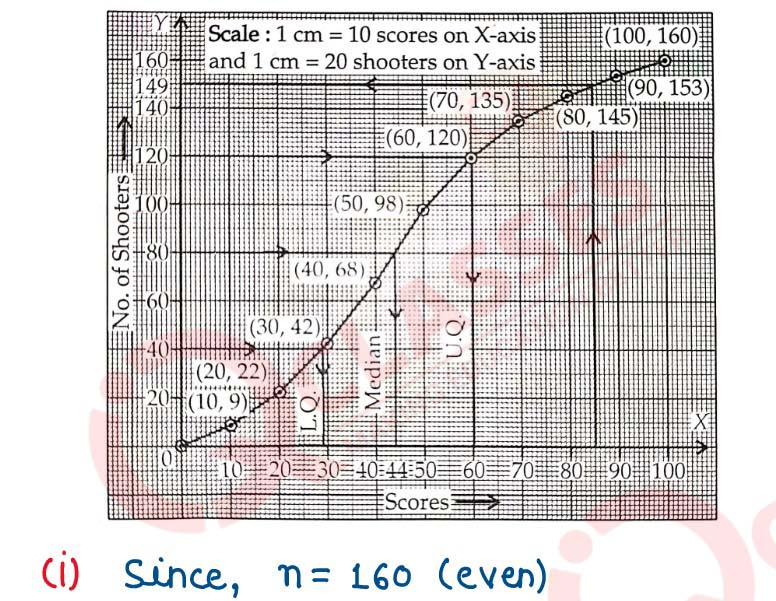
The table shows the distribution of the scores obtained by 160 shooters in a shooting competition.
Use a graph sheet and draw an ogive for the distribution. (Take 2 cm = 10 scores on the X-axis and 2
cm = 20 shooters on the Y-axis)
Use your graph to estimate the following:
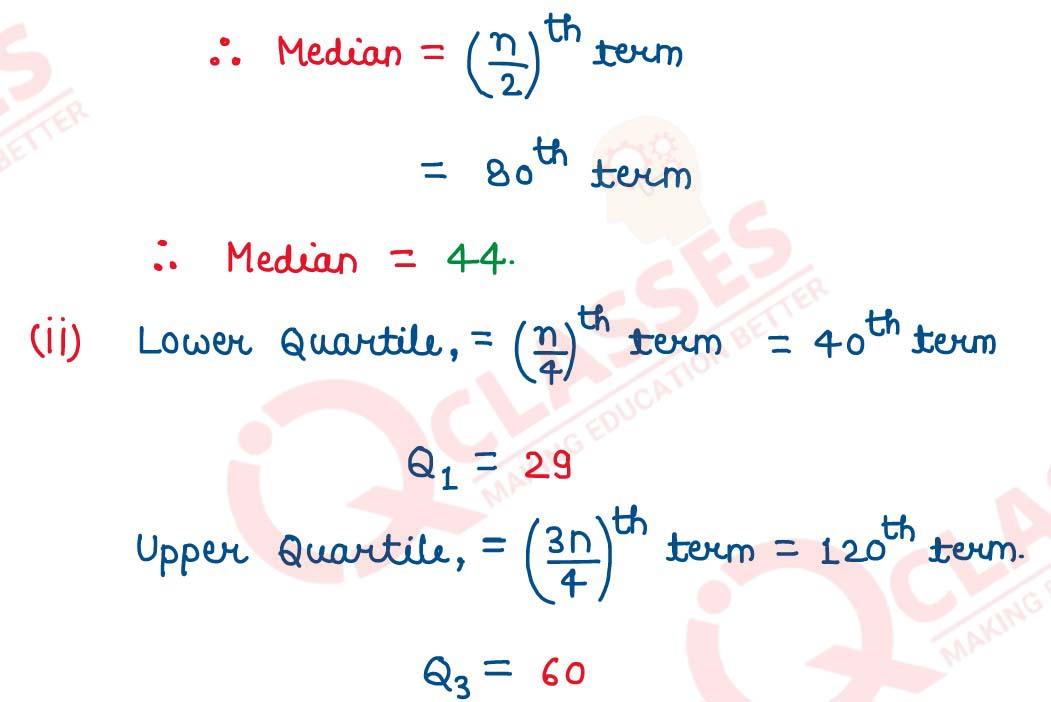
(i) The median.
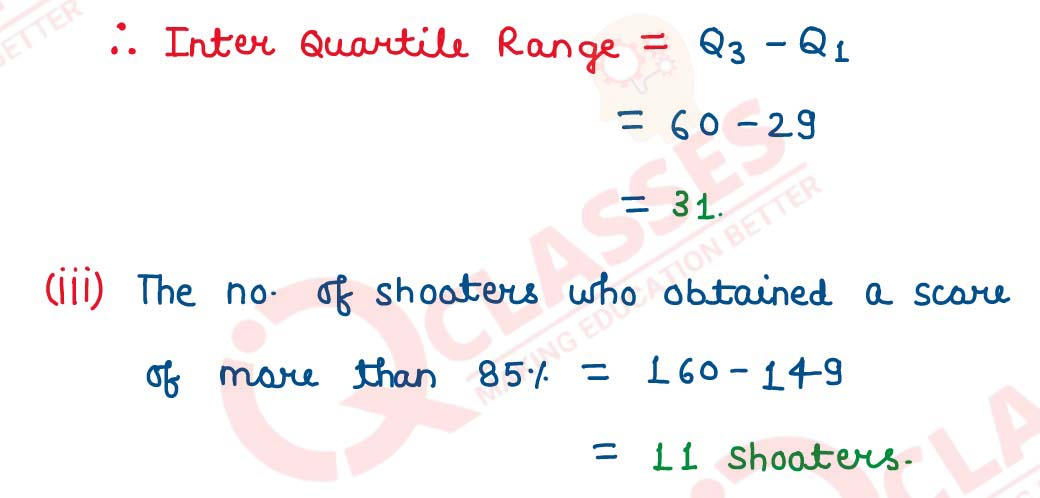
(ii) The interquartile range.
(iii) The number of shooters who obtained a score of more than 85%.
solutions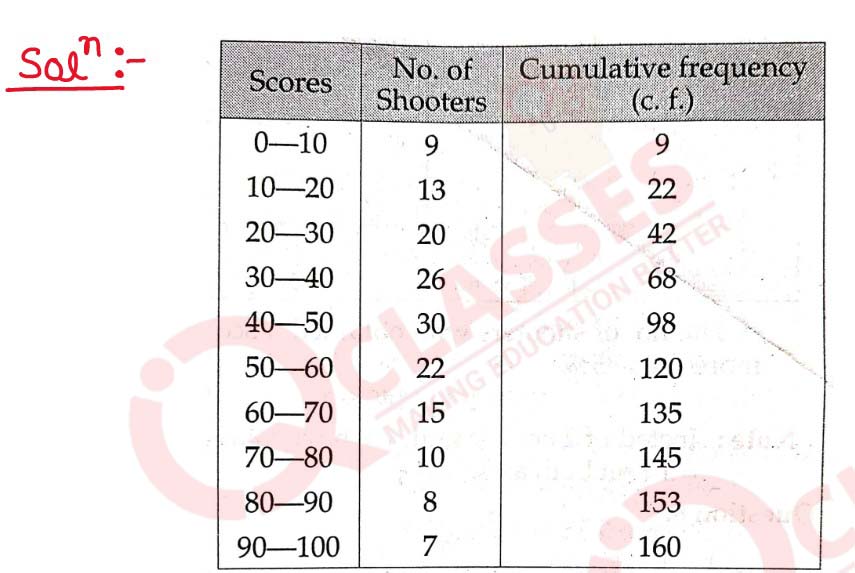
Use your graph to estimate the following:
(i) The median.
(ii) The interquartile range.
(iii) The number of shooters who obtained a score of more than 85%.
solutions
Q3
The histogram below represents the scores obtained by 25 students in a mathematics mental test. Use
the data to :
(i) Frame a frequency distribution table
(ii) To calculate mean
(iii) To determine the Modal class
solutions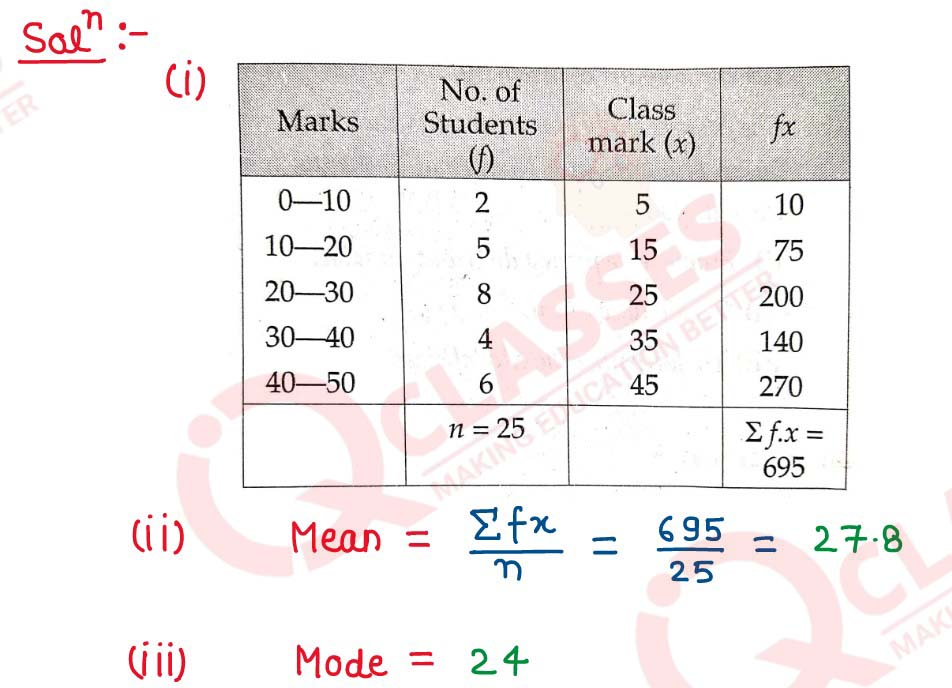

(i) Frame a frequency distribution table
(ii) To calculate mean
(iii) To determine the Modal class
solutions
2017
Q4
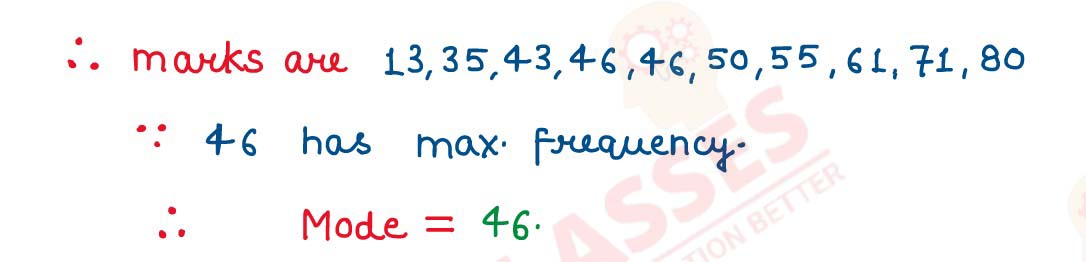
The marks of 10 students of a class in an examination arranged in ascending order is as follows: 13,
35, 43, x, x + 4, 55, 61, 71, 80. If the median marks is 48, find the value of x. Hence find the
mode of the given data.
solutions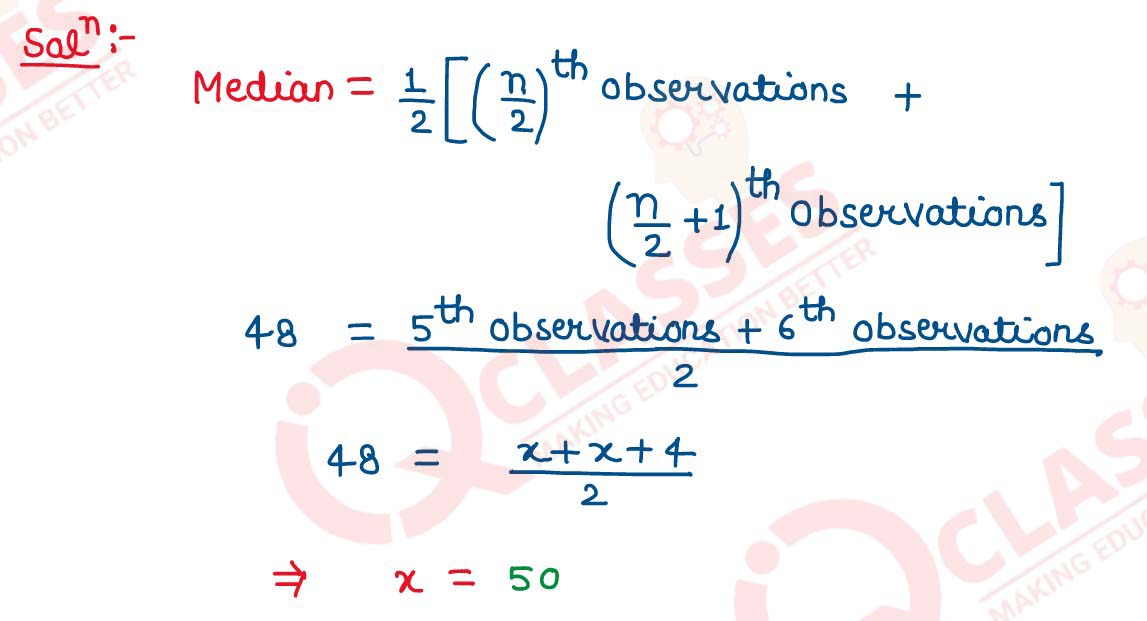
solutions
Q5
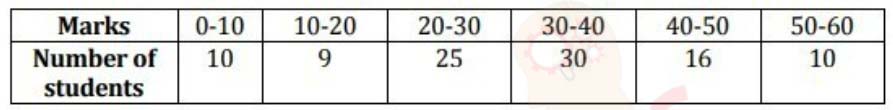
Calculate the mean of the following distribution using step deviation method.
solutions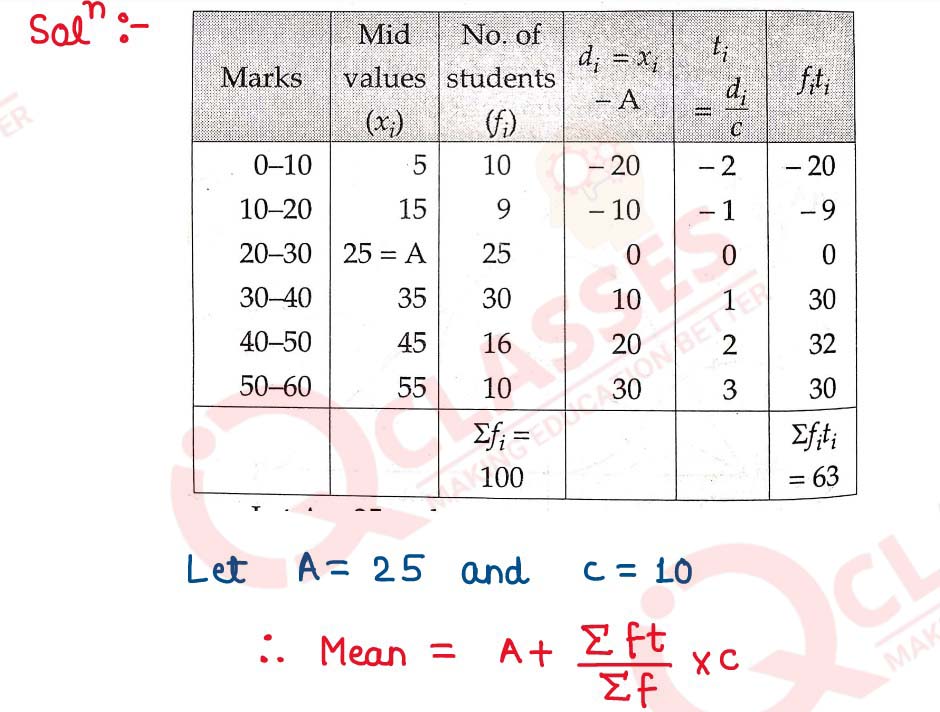

solutions
Q6
The daily wages of 80 workers in a project are given below.
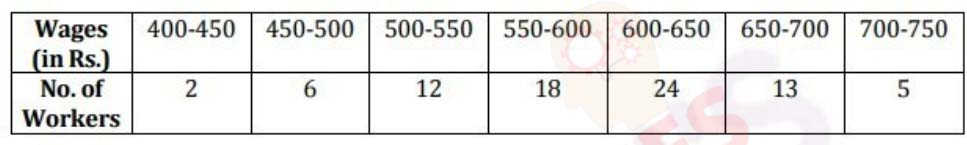
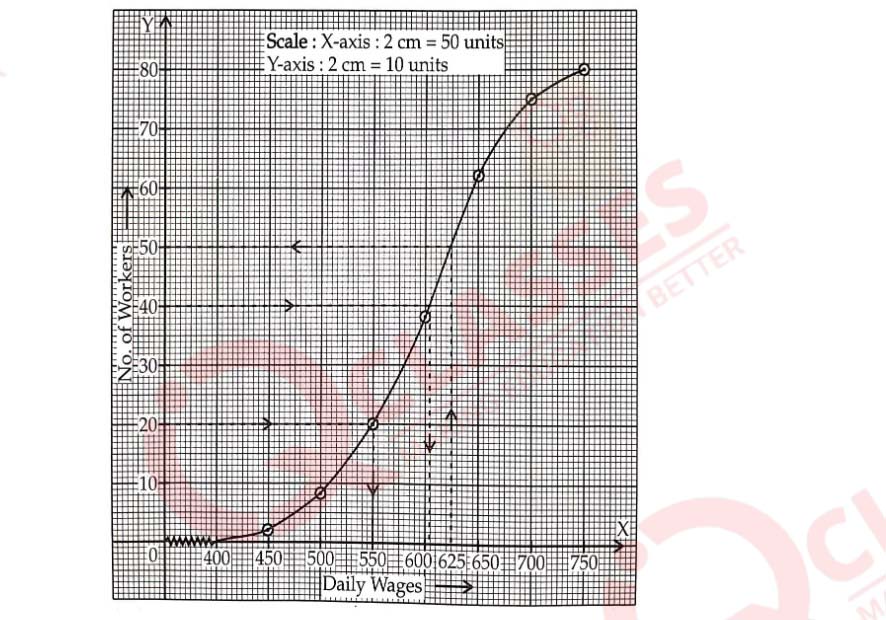
Use a graph paper to draw an ogive for the above distribution. (Use a scale of 2 cm = Rs. 50 on x-axis and 2 cm = 10 workers on y-axis). Use your ogive to estimate:
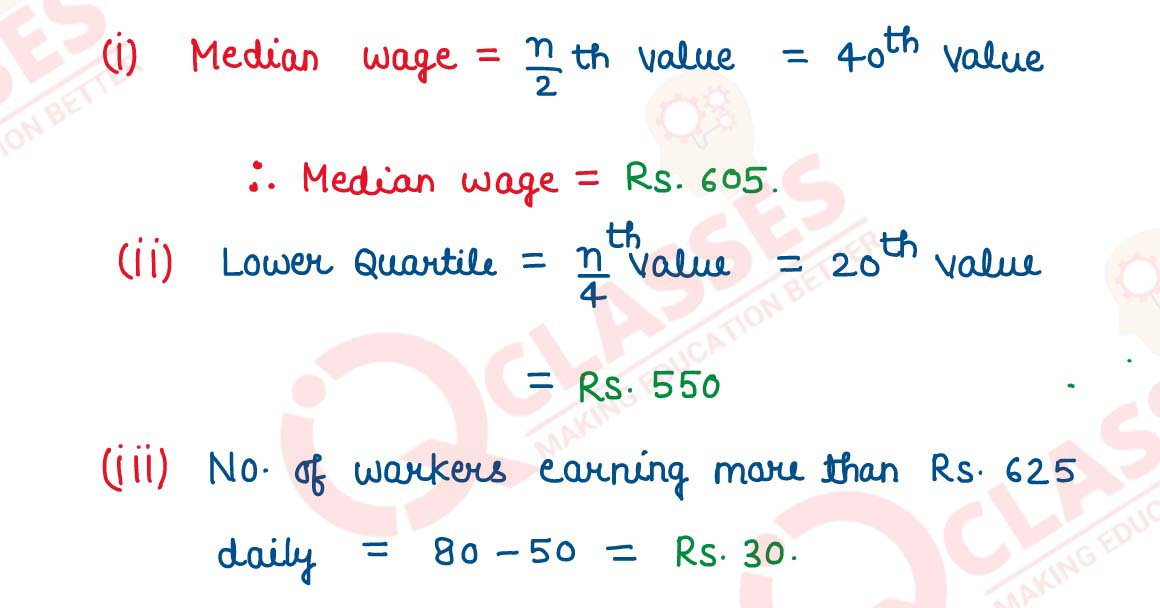
(i) the median wage of the workers
(ii) the lower quartile wage of workers
(iii) the numbers of workers who earn more than Rs. 625 daily.
solutions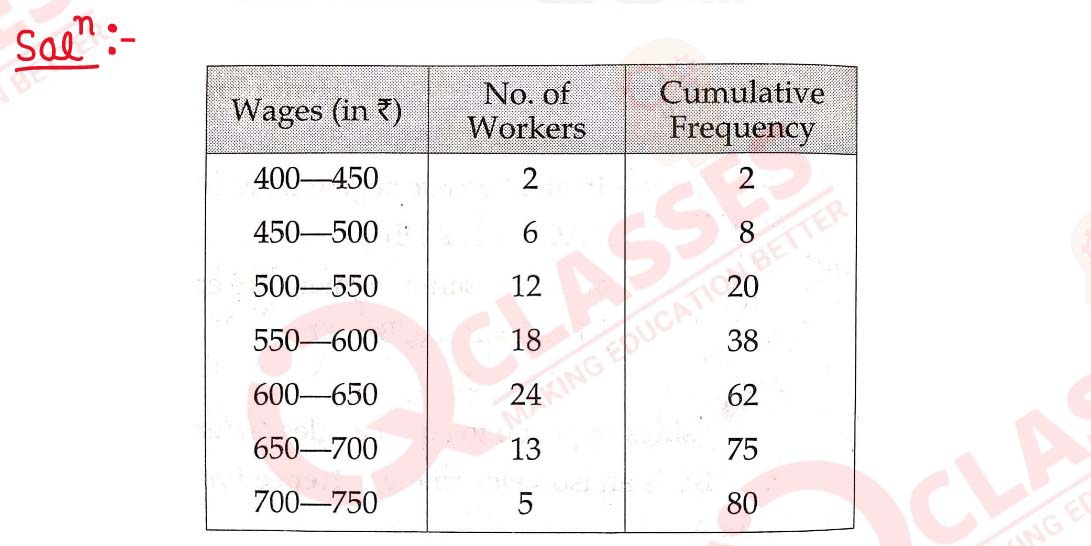
Use a graph paper to draw an ogive for the above distribution. (Use a scale of 2 cm = Rs. 50 on x-axis and 2 cm = 10 workers on y-axis). Use your ogive to estimate:
(i) the median wage of the workers
(ii) the lower quartile wage of workers
(iii) the numbers of workers who earn more than Rs. 625 daily.
solutions
2018
Q7
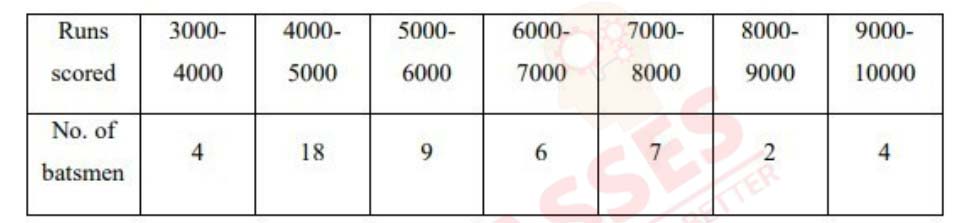
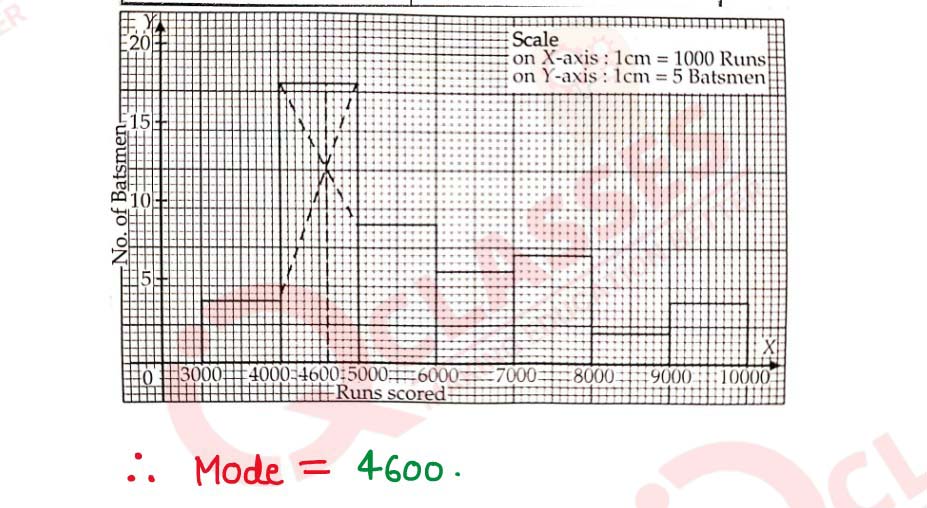
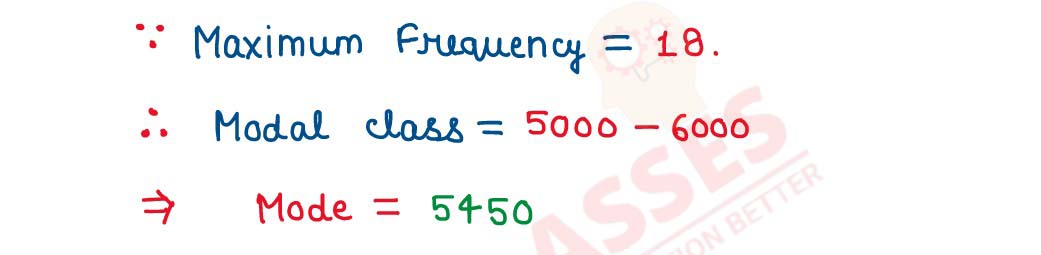
Using a graph paper draw a histogram for the given distribution showing the number of runs scored by
50 batsmen. Estimate the mode of the data:
solutions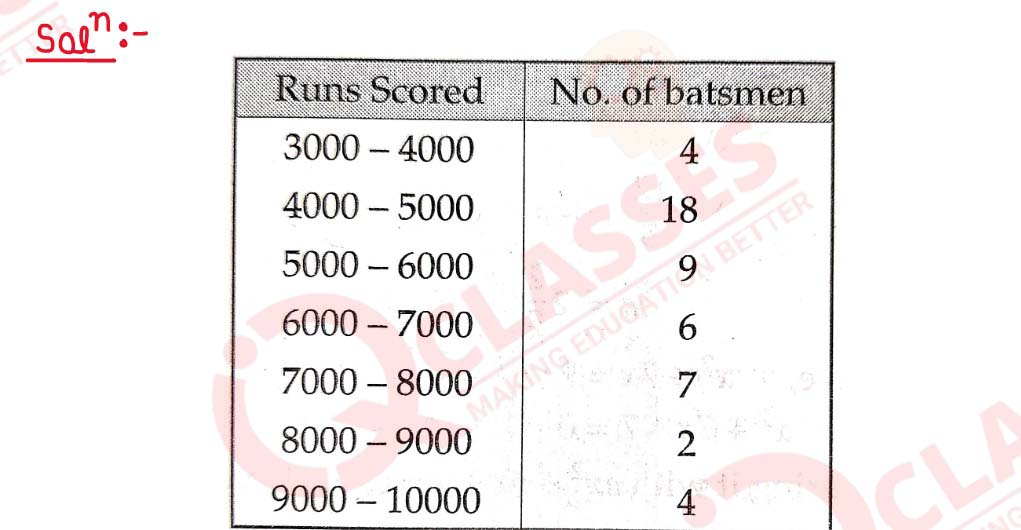
solutions
Q8
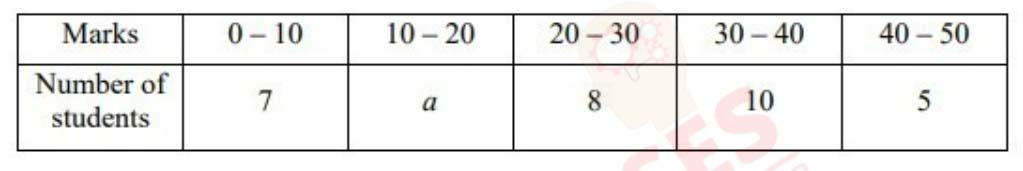
If the mean of the following distribution is 24, find the value of 'a '.
solutions

solutions
Q9
Use Graph paper for this question.
A survey regarding height (in cm) of 60 boys belonging to Class 10 of a school was conducted. The following data was recorded:
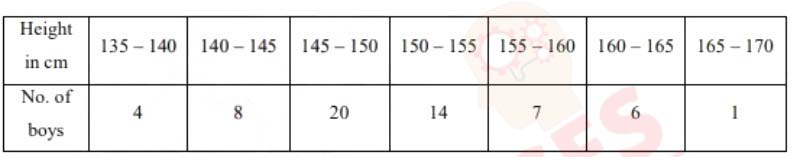
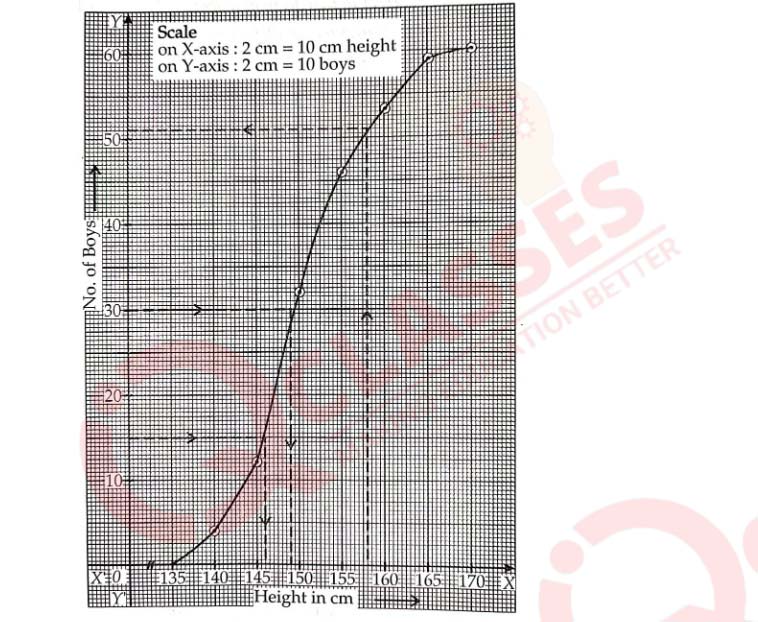
Taking 2cm = height of 10 cm along one axis and 2 cm = 10 boys along the other axis draw an ogive of the above distribution. Use the graph to estimate the following:
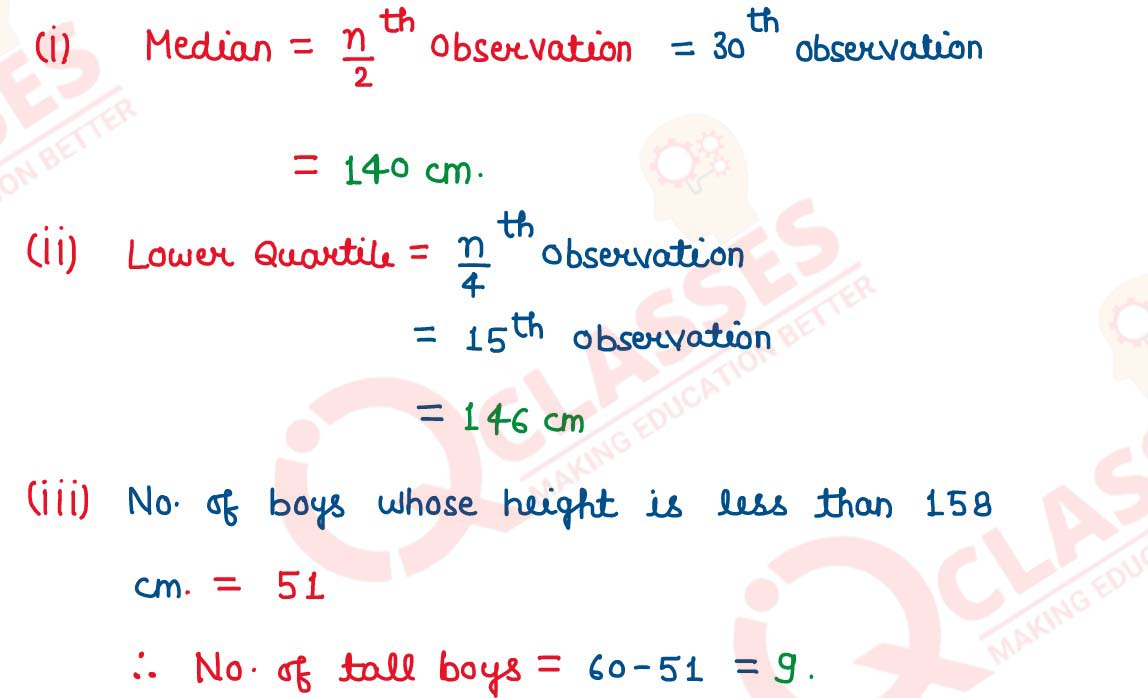
(i) the median
(ii) lower Quartile
(iii) if above 158 cm is considered as the tall boys of the class. Find the number of boys in the class who are tall.
solutions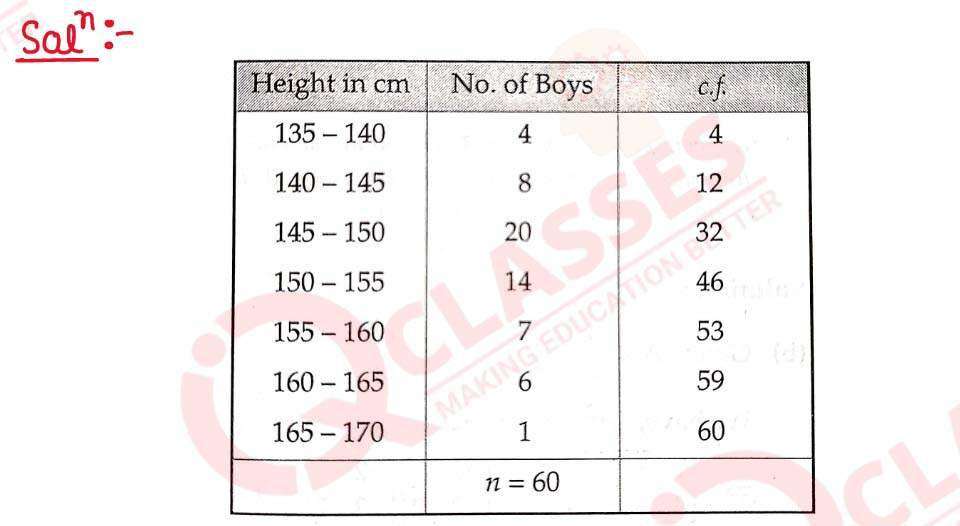
A survey regarding height (in cm) of 60 boys belonging to Class 10 of a school was conducted. The following data was recorded:
Taking 2cm = height of 10 cm along one axis and 2 cm = 10 boys along the other axis draw an ogive of the above distribution. Use the graph to estimate the following:
(i) the median
(ii) lower Quartile
(iii) if above 158 cm is considered as the tall boys of the class. Find the number of boys in the class who are tall.
solutions
2019
Q10
In a class of 40 students, marks obtain ,All by the students in a class test (out of 10) are given
below:
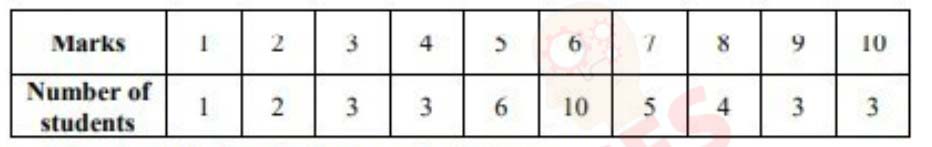
Calculate the following for the given distribution:
(i) Median
(ii) Mode
solutions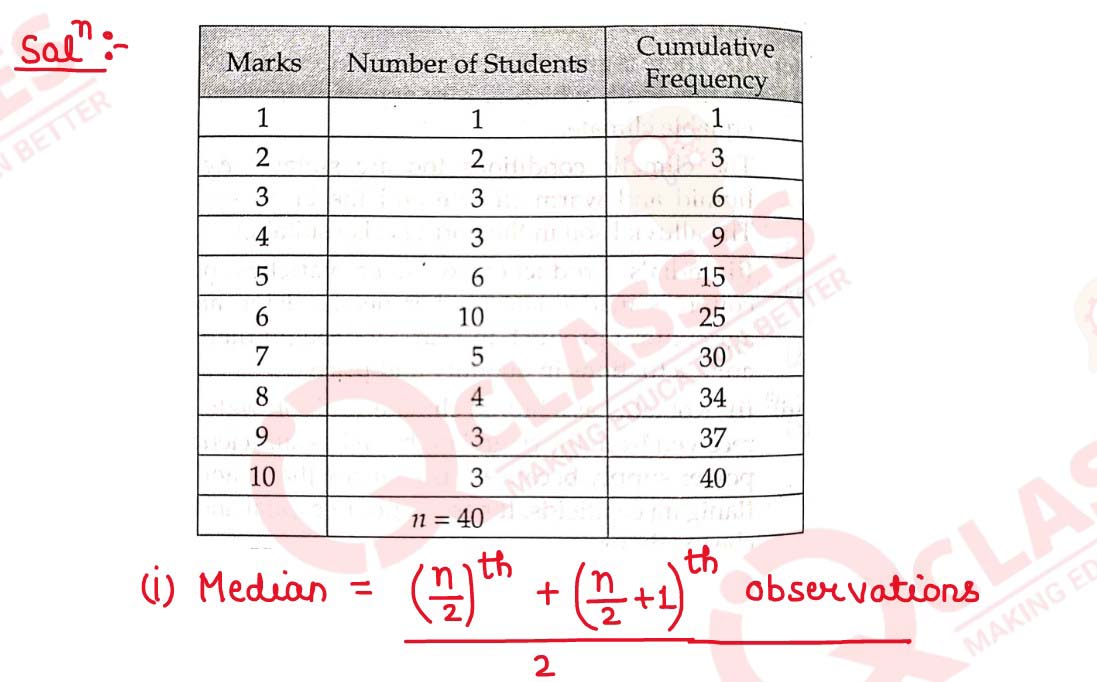
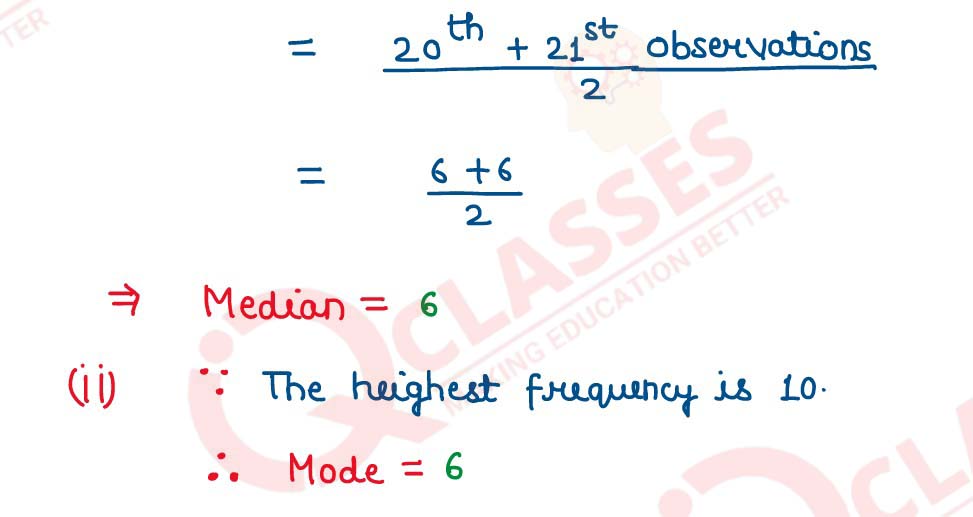
Calculate the following for the given distribution:
(i) Median
(ii) Mode
solutions
Q11
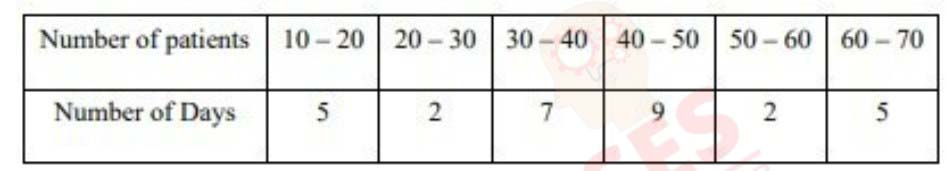
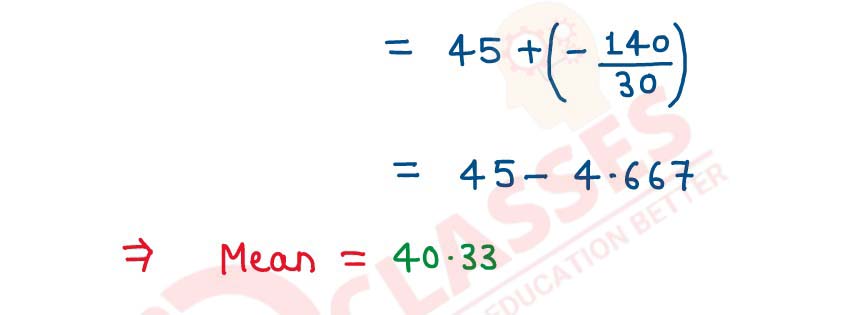
The data on the number of patients attending a hospital in a month are given below. Find the average
(mean) number of patients attending the hospital in a month by using the shortcut method.
Take the assumed mean as 45. Give your answer correct to 2 decimal places.
solutions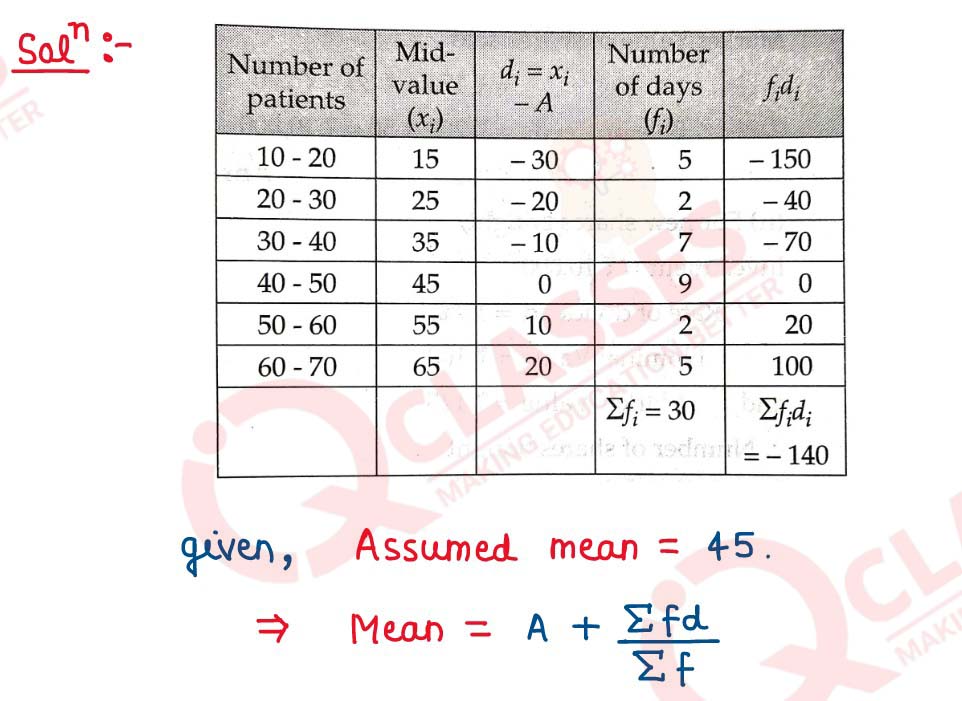
Take the assumed mean as 45. Give your answer correct to 2 decimal places.
solutions
Q12
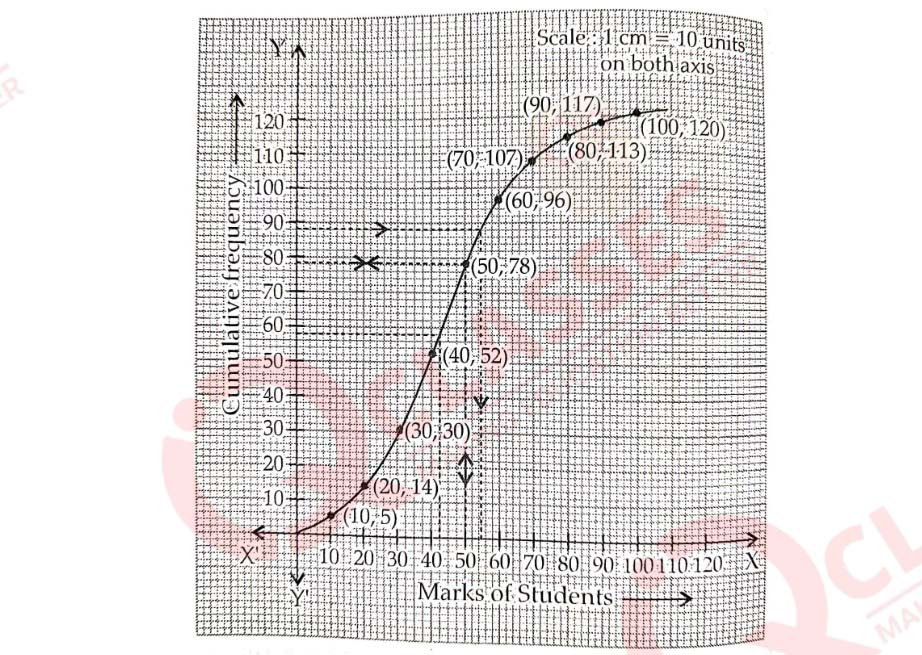
Use graph paper for this question. The marks obtained by 120 students in an English test are given
below:
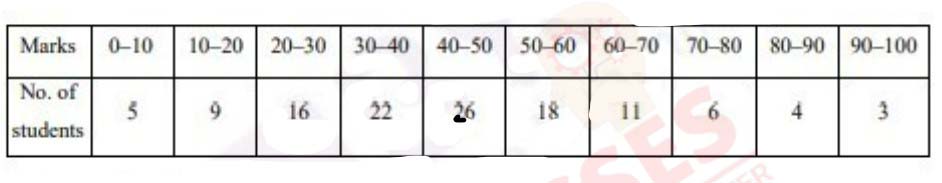 Draw the ogive and hence, estimate:
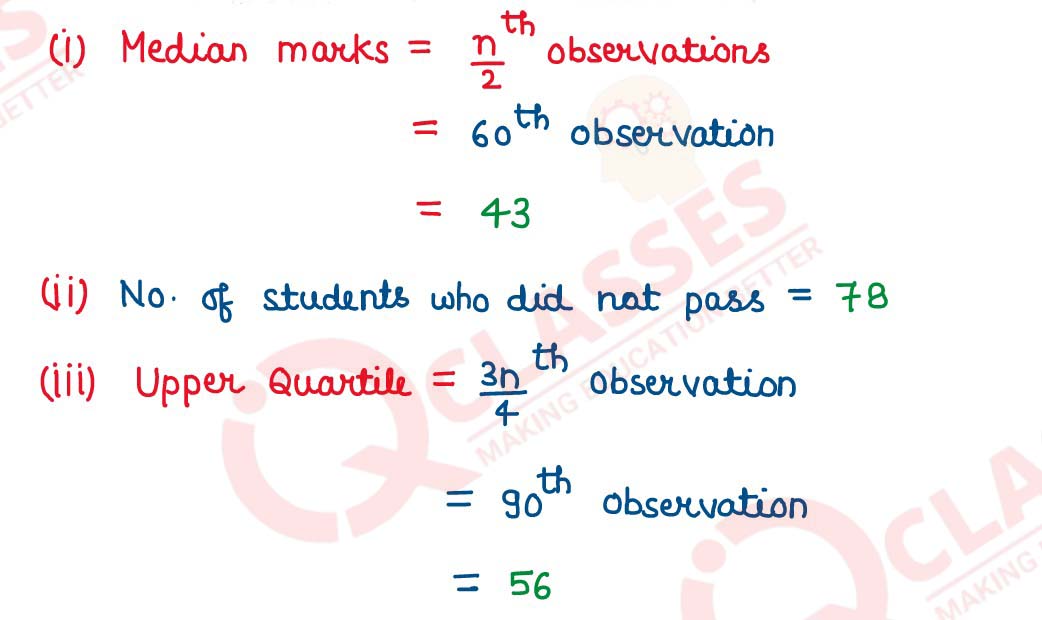
(i) the median marks.
(ii) the number of students who did not pass the test if the pass percentage was 50.
(iii) the upper quartile marks.
solutions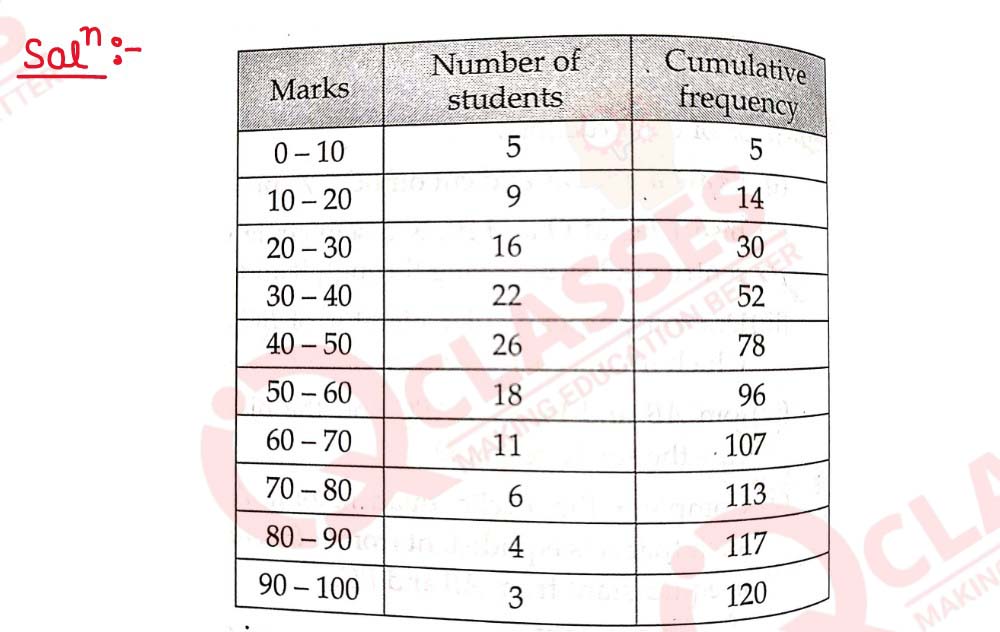
Draw the ogive and hence, estimate:(i) the median marks.
(ii) the number of students who did not pass the test if the pass percentage was 50.
(iii) the upper quartile marks.
solutions
2020
Q13
Draw a Histogram for the given data, using a graph paper:
Estimate the mode from the graph.
solutions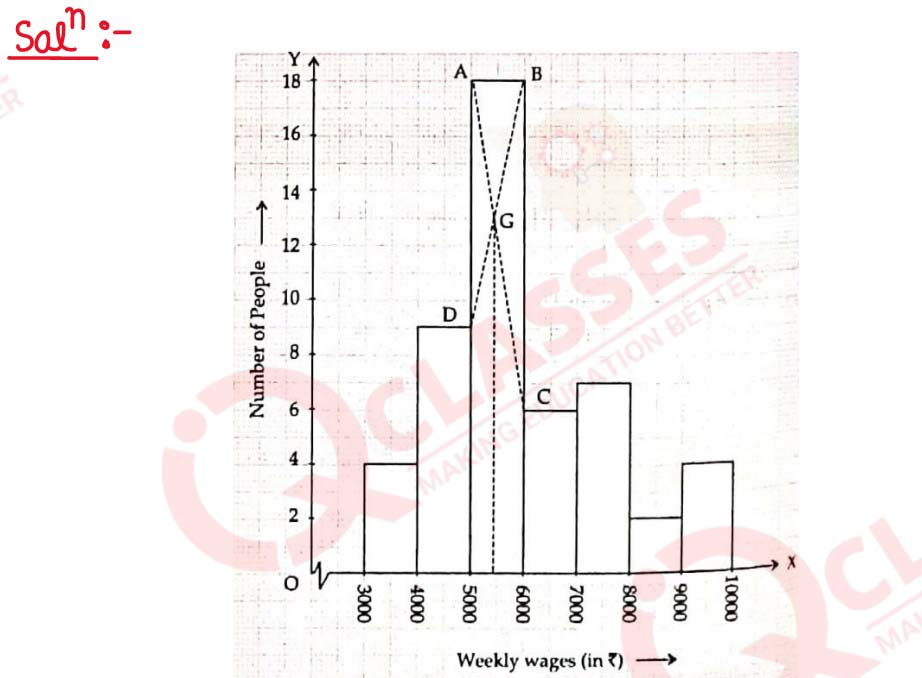
Estimate the mode from the graph.
solutions
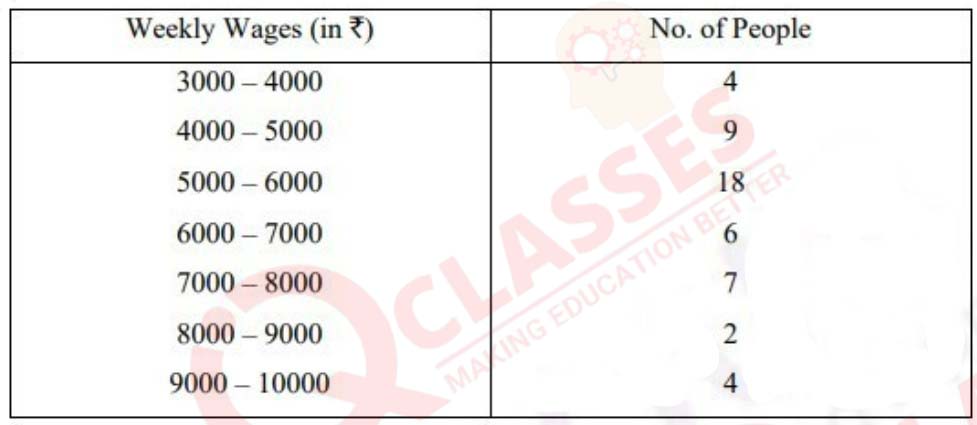
Q14
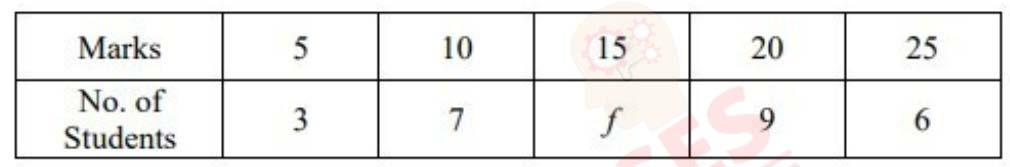
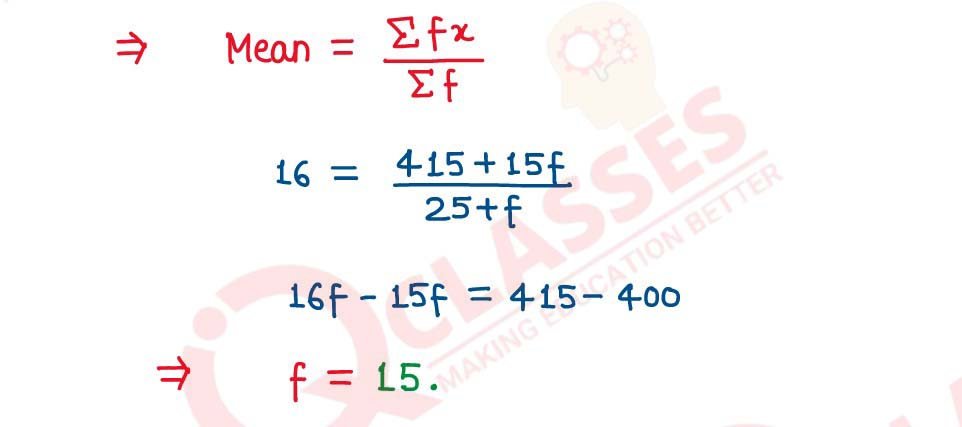
The mean of the following data is 16. Calculate the value off
solutions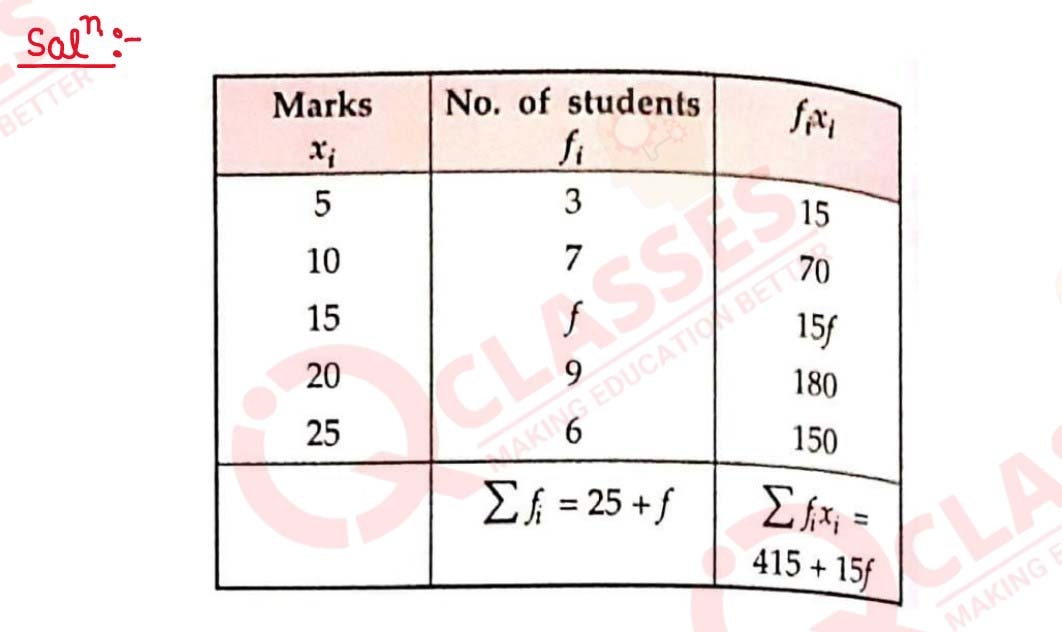
solutions
Q15
40 students enter for a game of shot-put competition. The distance thrown (in metres) is recorded
below:
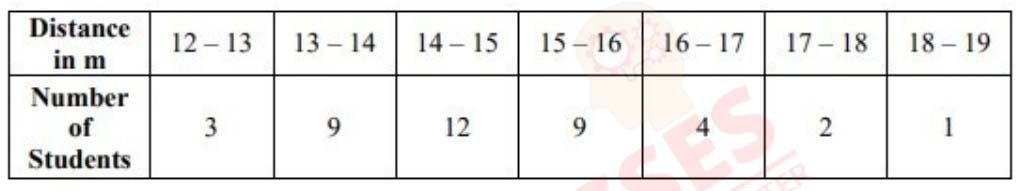
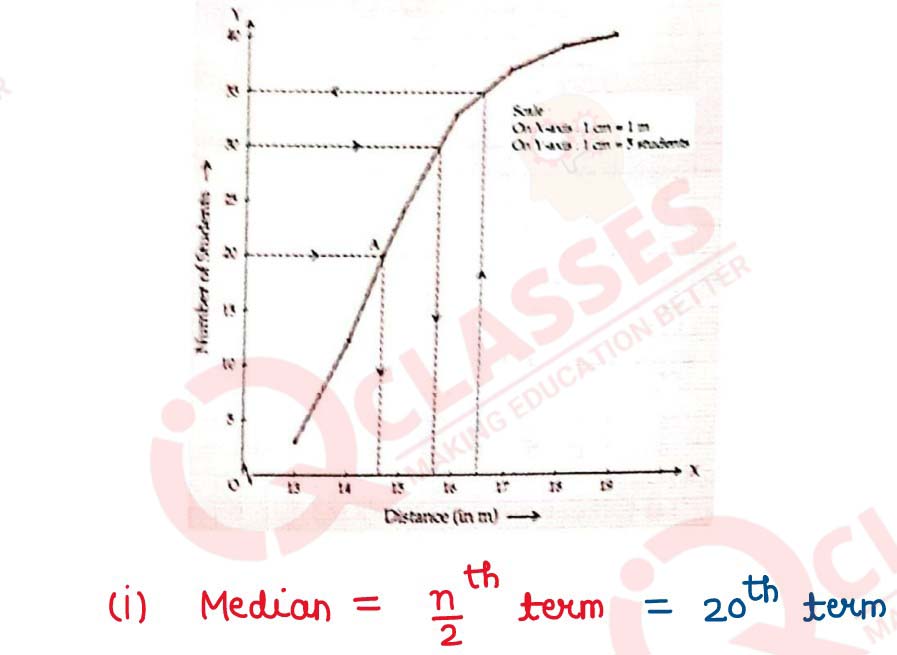
Use a graph paper to draw an ogive for the above distribution. Use a scale of 2 cm = 1 m on one axis and 2 cm = 5 students on the other axis. Hence using your graph find:
(i) the median
(ii) Upper Quartile
(iii) Number of students who cover a distance which is above 16(1/2) m.
solutions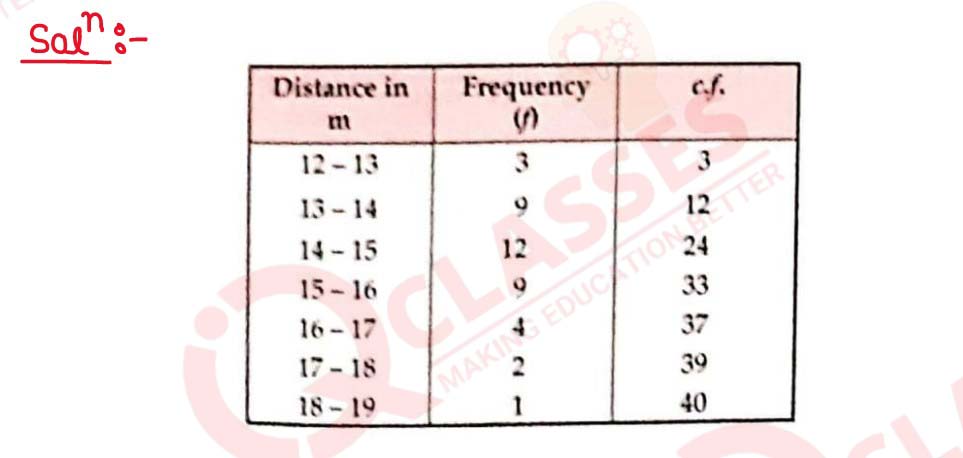

Use a graph paper to draw an ogive for the above distribution. Use a scale of 2 cm = 1 m on one axis and 2 cm = 5 students on the other axis. Hence using your graph find:
(i) the median
(ii) Upper Quartile
(iii) Number of students who cover a distance which is above 16(1/2) m.
solutions


Reach Us
SERVICES
- ACADEMIC
- ON-LINE PREPARATION
- FOUNDATION & CRASH COURSES
CONTACT
B-54, Krishna Bhawan, Parag Narain Road,
Near Butler Palace Colony Lucknow
Contact:+918081967119
Add a comment