Statistics Chapter Important Questions Class 10 CBSE
Here we provide Class 10 Maths important notes,board questions and predicted questions with Answers for chapter Statistics. These important notes,board questions and predicted questions are based on CBSE board curriculum and correspond to the most recent Class 10 Maths syllabus. By practising these Class 10 materials, students will be able to quickly review all of the ideas covered in the chapter and prepare for the Class 10 Board examinations.
Q1
solutions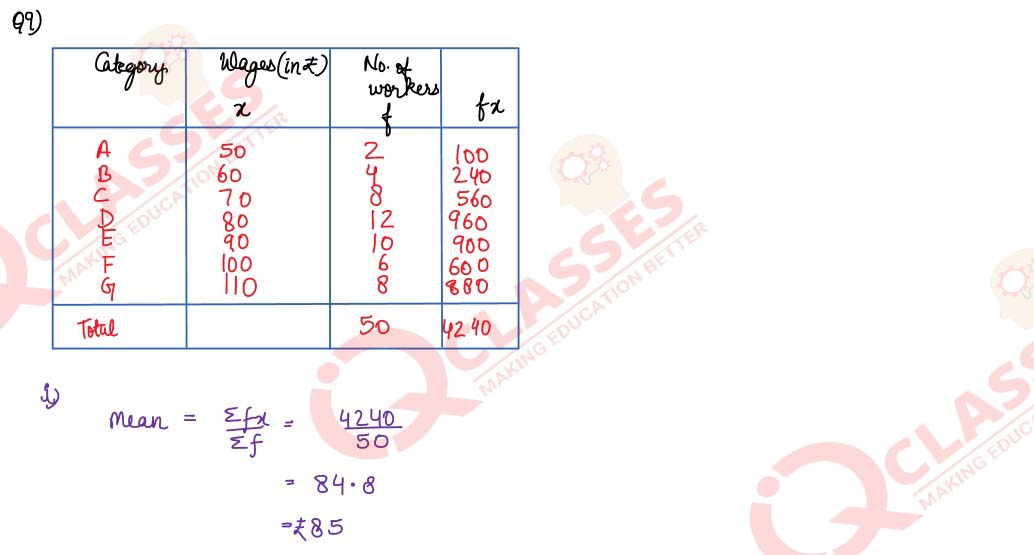

| Category | A | B | C | D | E | F | G |
|---|---|---|---|---|---|---|---|
| Wages (in Rs) per day | 50 | 60 | 70 | 80 | 90 | 100 | 110 |
| No. of workers | 2 | 4 | 8 | 12 | 10 | 6 | 8 |
solutions
Q2
If the mean of the following distribution is 7.5, find the missing frequency f
solutions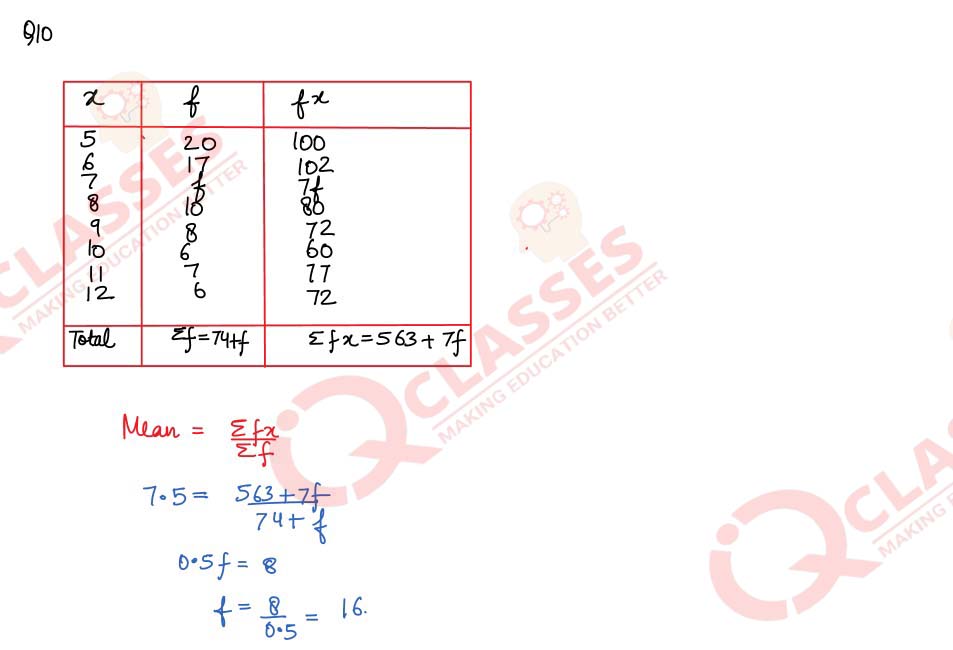
| Variate | 5 | 6 | 7 | 8 | 9 | 10 | 11 | 12 |
|---|---|---|---|---|---|---|---|---|
| Frequency | 20 | 17 | f | 10 | 8 | 6 | 7 | 6 |
solutions
Q3
Calculate the arithmetic mean of 5.7, 6.6, 7.2, 9.3, 6.2.
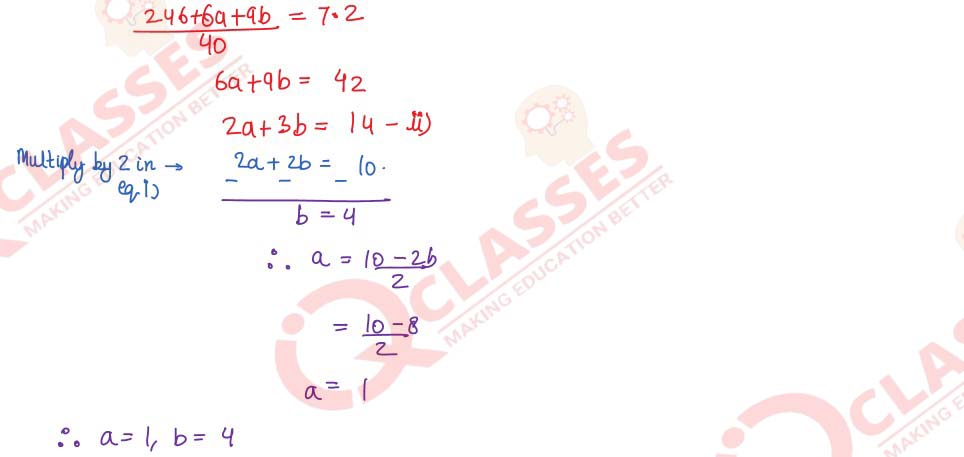
If the mean of the distribution is 7.2, find a and b.
solutions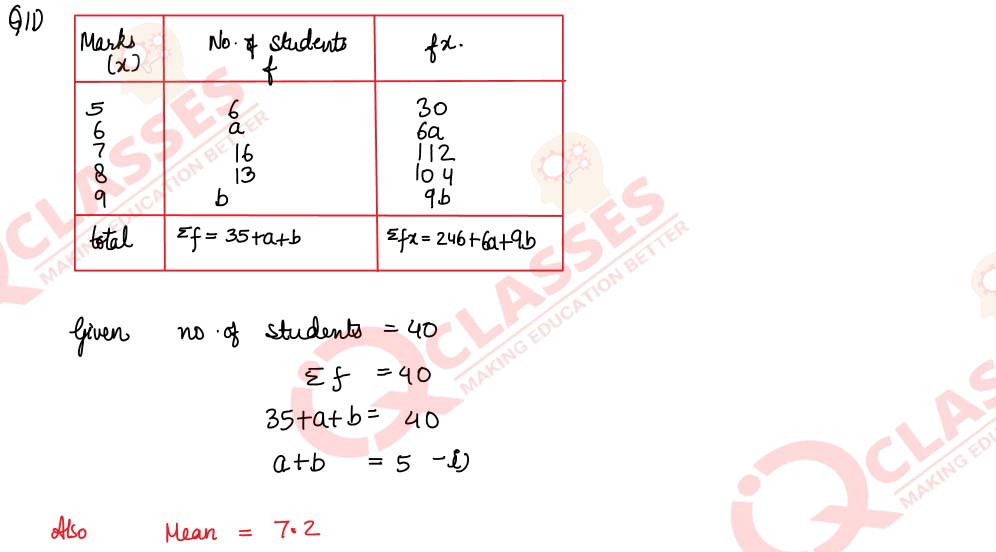
| Marks | 5 | 6 | 7 | 8 | 9 |
|---|---|---|---|---|---|
| No. of students | 6 | a | 16 | 13 | b |
If the mean of the distribution is 7.2, find a and b.
solutions
Q4
If the mean ot the following distribution is 24, find the value of a:
solutions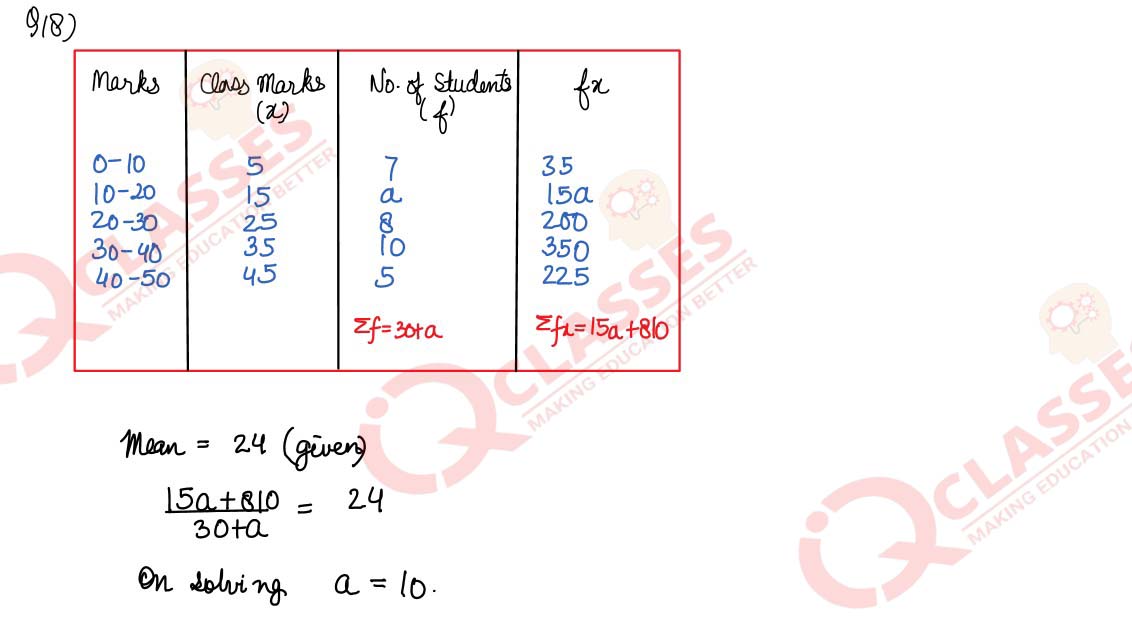
| Marks | 0-10 | 10-20 | 20-30 | 30-40 | 40-50 |
|---|---|---|---|---|---|
| Number of students | 7 | a | 8 | 10 | 5 |
solutions
Q5
The mean of the following frequency distribution is 57.6 and the sum of all the
frequencies is 50. Find the values of p and q
solutions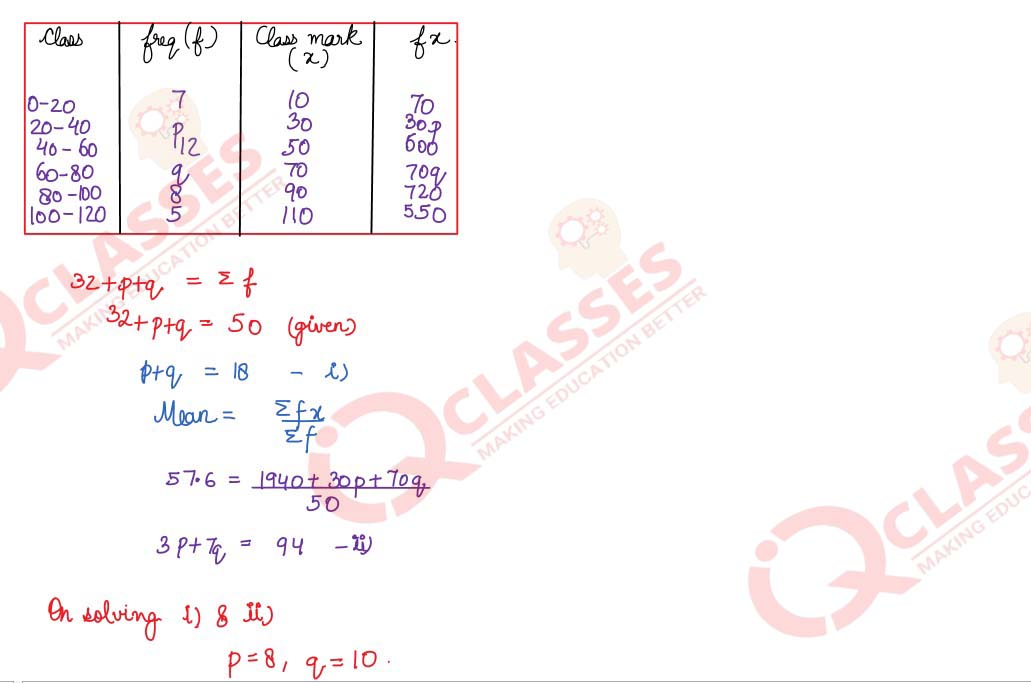
| Classes | 0-20 | 20-40 | 40-60 | 60-80 | 80-100 | 100-120 |
|---|---|---|---|---|---|---|
| Frequency | 7 | p | 12 | q | 8 | 5 |
solutions
Q6
Marks obtained by 70 students are given below :
Calculate the median marks
solutions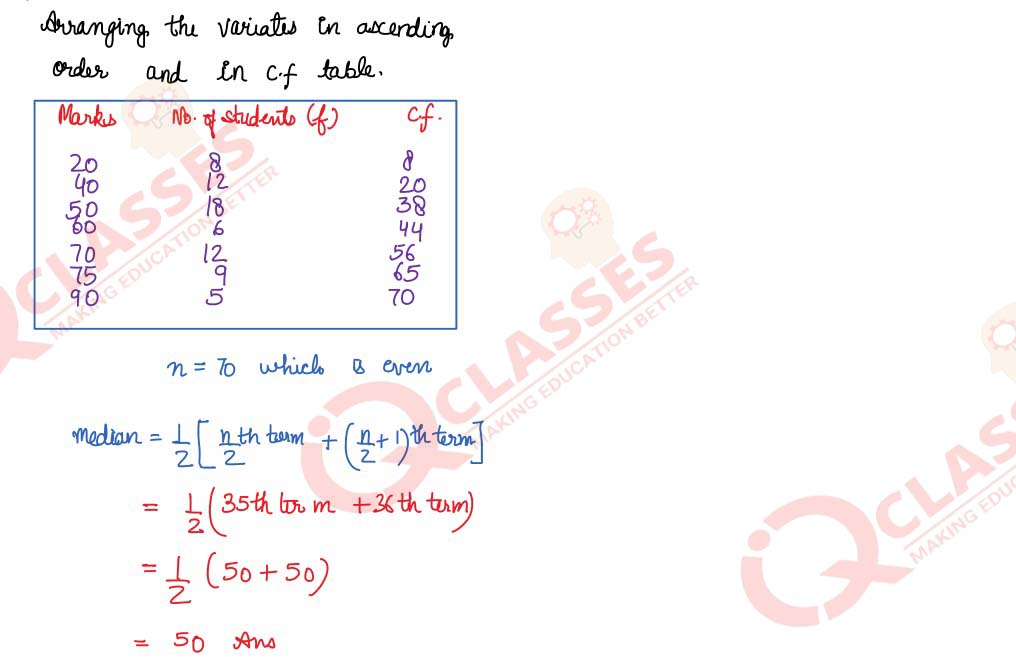
| Marks | 20 | 70 | 50 | 60 | 75 | 90 | 40 |
|---|---|---|---|---|---|---|---|
| No. of students | 8 | 12 | 18 | 6 | 9 | 5 | 12 |
Calculate the median marks
solutions
Q7
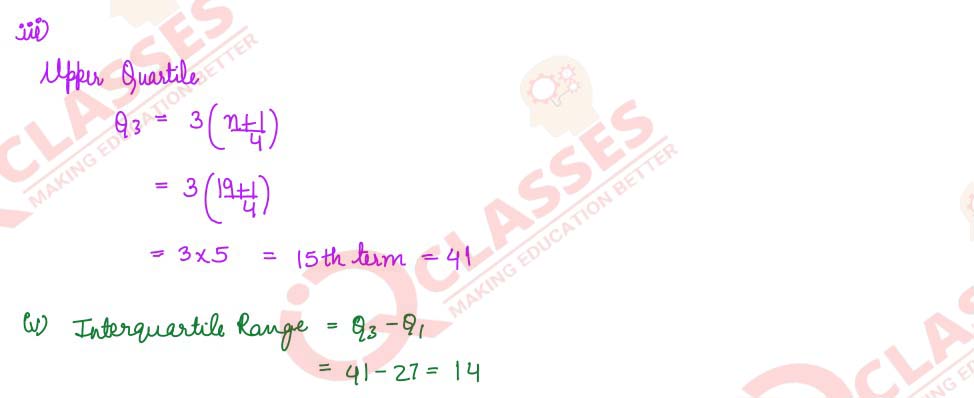
The daily wages in (rupees of) 19 workers are
41, 21, 38, 27, 31, 45, 23, 26, 29, 30, 28, 25, 35, 42, 47, 53, 29, 31, 35
find:
(i) the median
(ii) lower quartile
(iii) upper quartile
(iv) inter quartile range
solutions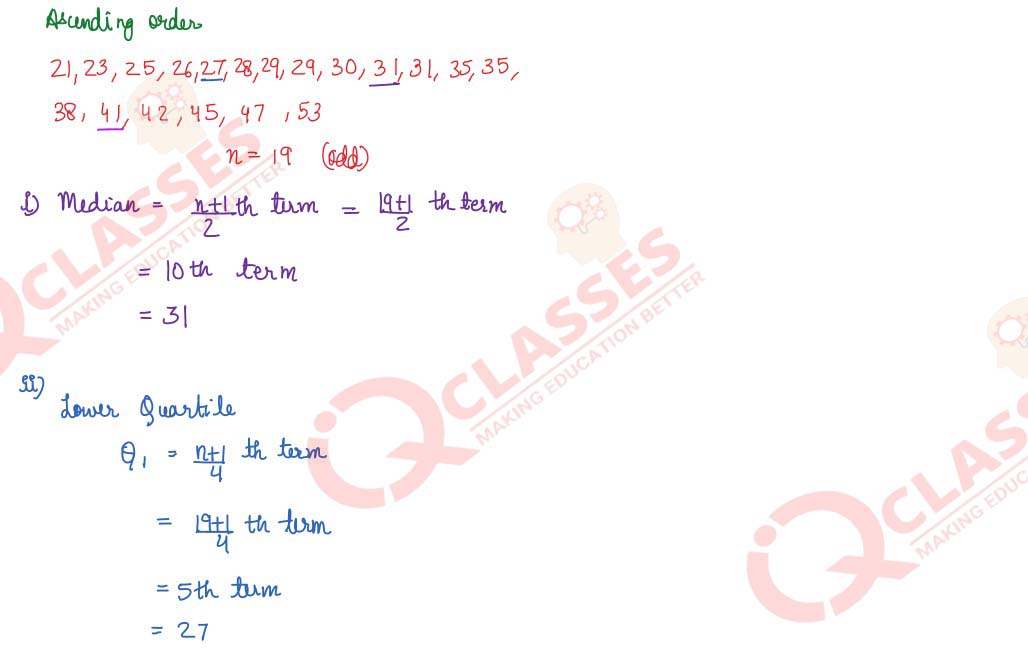
41, 21, 38, 27, 31, 45, 23, 26, 29, 30, 28, 25, 35, 42, 47, 53, 29, 31, 35
find:
(i) the median
(ii) lower quartile
(iii) upper quartile
(iv) inter quartile range
solutions
Q8
From the following frequency distribution, find :
(i) the median
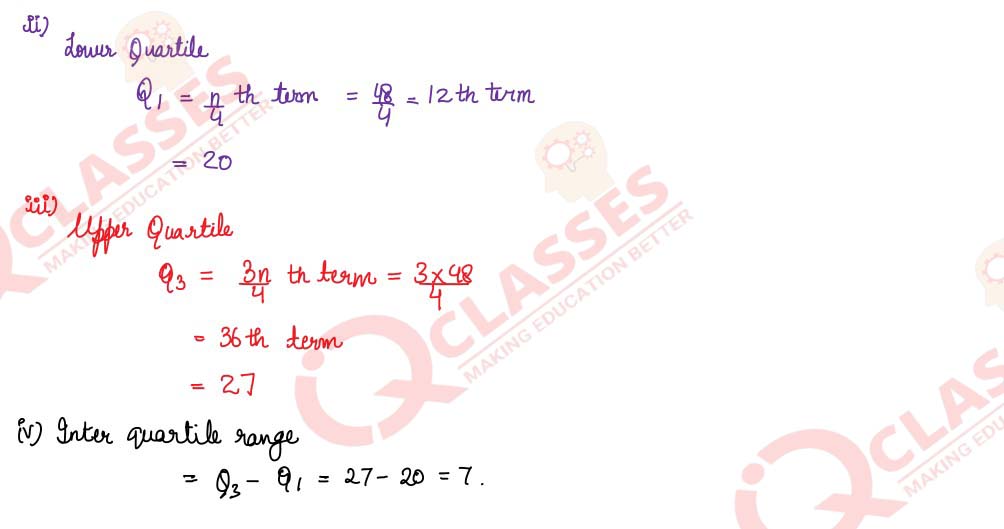
(ii) lower quartile
(iii) upper quartile
(iv) inter quartile range
solutions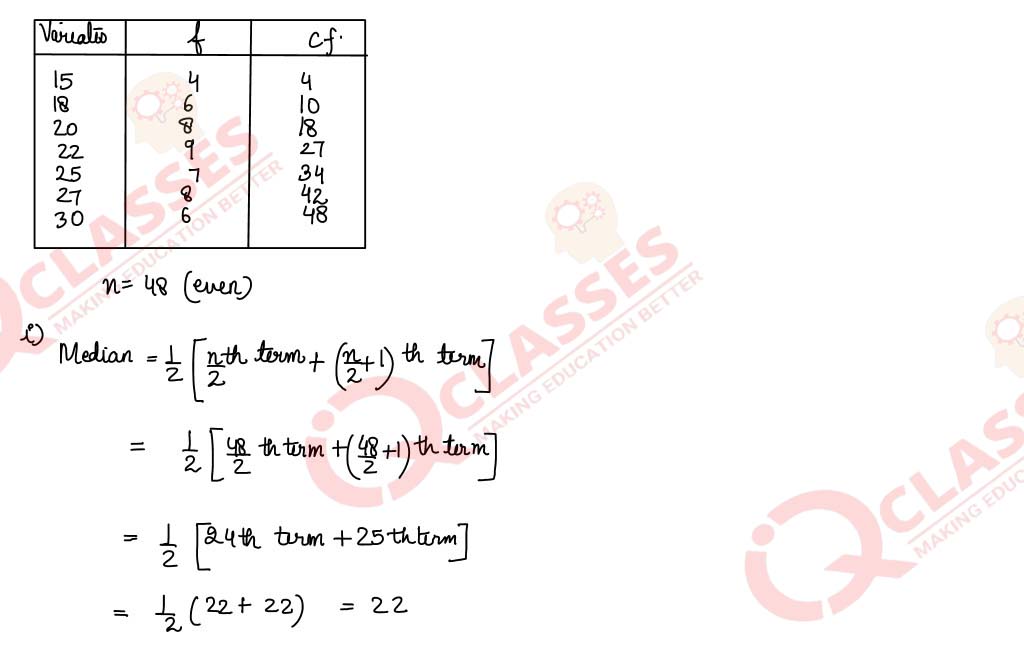
(i) the median
(ii) lower quartile
(iii) upper quartile
(iv) inter quartile range
| Variate | 15 | 18 | 20 | 22 | 25 | 27 | 30 |
|---|---|---|---|---|---|---|---|
| Frequency | 4 | 6 | 8 | 9 | 7 | 8 | 6 |
solutions
Q9
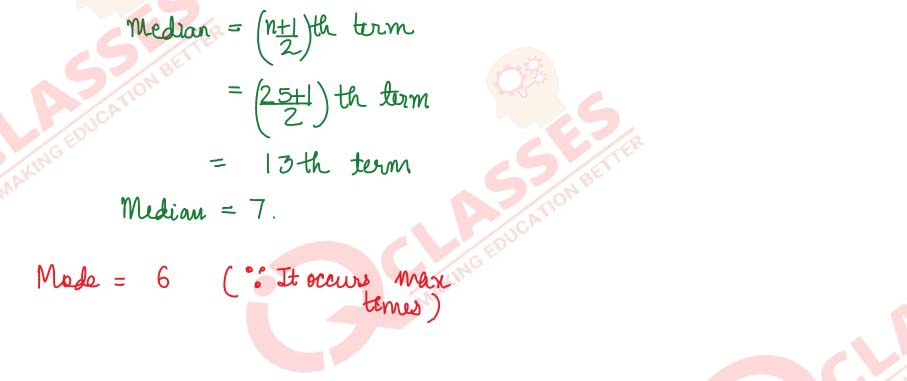
The marks of 10 students of a class in an examination arranged in ascending order are as follows:
43, 46, x, x +4, 55, 61,71, 80
If the median marks is 48, find the value of x. Hence, find the mode of the given data.
solutions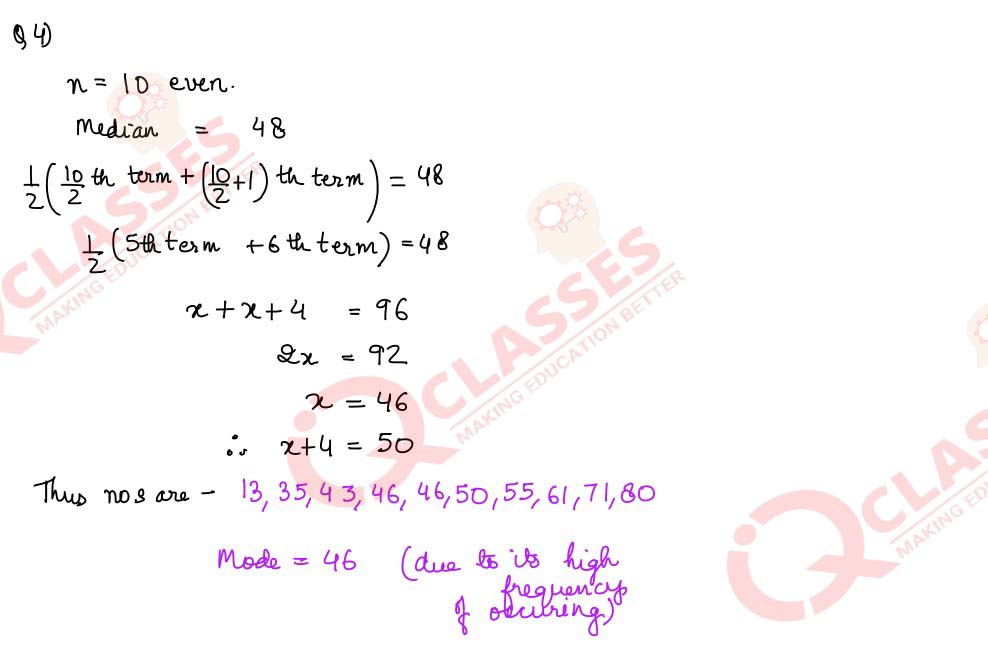
43, 46, x, x +4, 55, 61,71, 80
If the median marks is 48, find the value of x. Hence, find the mode of the given data.
solutions
Q10
In a class of 40 students, marks obtained by the students in a class test (out of 10) are given
below:
Calculate the following for the given distribution:
(i) median
(ii) mode
solutions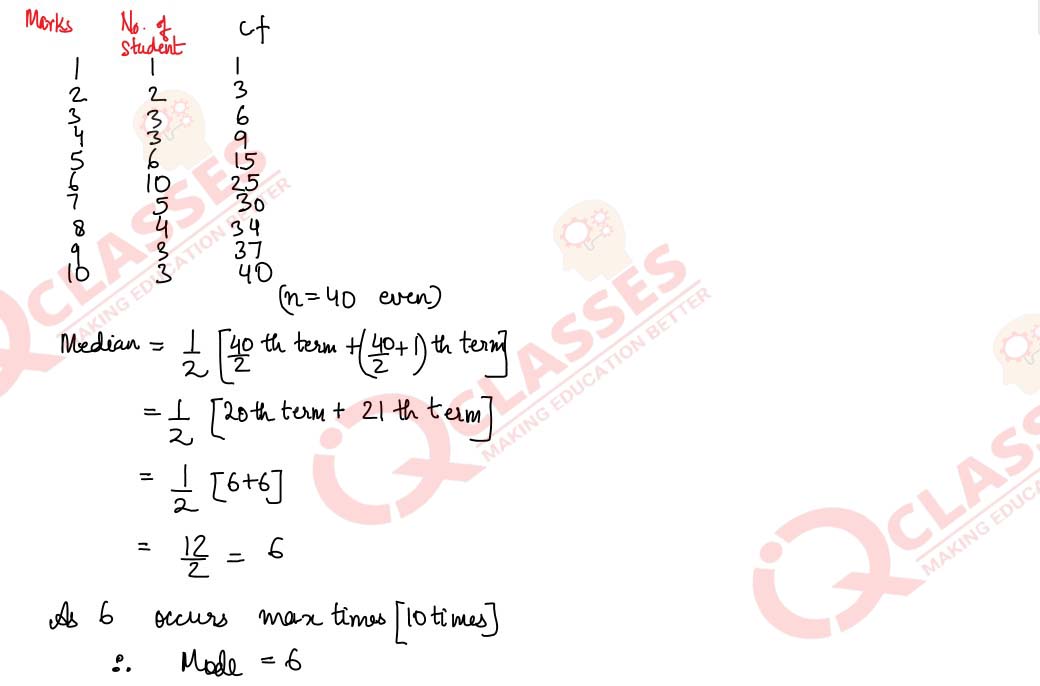
| Marks | 1 | 2 | 3 | 4 | 5 | 6 | 7 | 8 | 9 | 10 |
|---|---|---|---|---|---|---|---|---|---|---|
| Number of students | 1 | 2 | 3 | 3 | 6 | 10 | 5 | 4 | 3 | 3 |
Calculate the following for the given distribution:
(i) median
(ii) mode
solutions
Q11
The marks obtained by 30 students in a class assessment of 5 marks is given below:
Calculate the mean, median and mode of the above distribution
solutions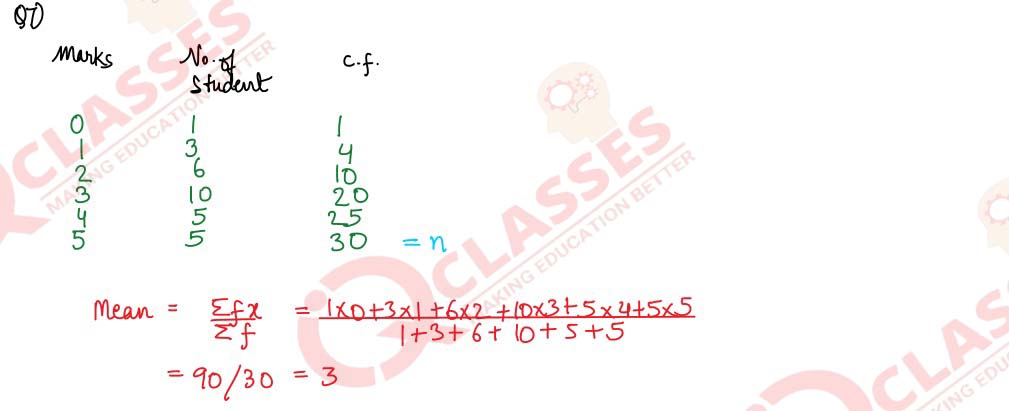
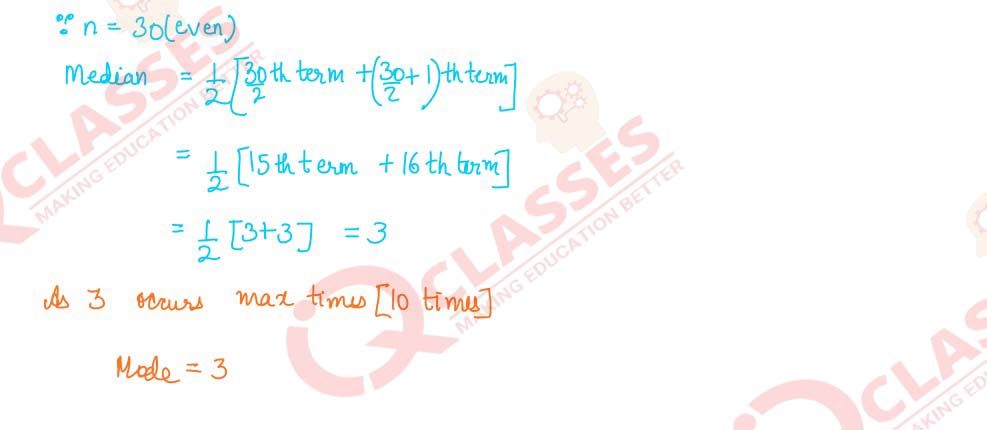
| Marks | 0 | 1 | 2 | 3 | 4 | 5 |
|---|---|---|---|---|---|---|
| Number of students | 1 | 3 | 6 | 10 | 5 | 5 |
solutions
Q12
The distribution given below shows the marks obtained by 25 students in an aptitude test. Find the
mean, median and mode of the distribution.
solutions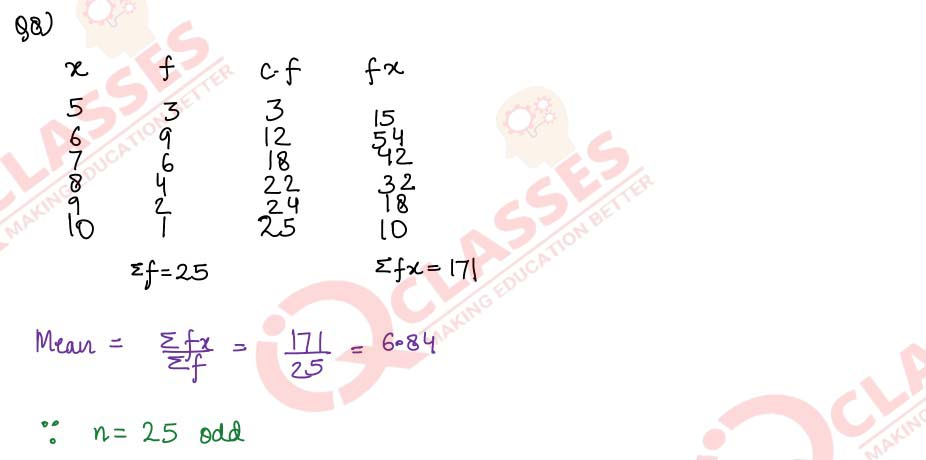
| Marks obtained | 5 | 6 | 7 | 8 | 9 | 10 |
|---|---|---|---|---|---|---|
| No. of students | 3 | 9 | 6 | 4 | 2 | 1 |
solutions
Q13
The following table gives the weekly wages (in Rs.) of workers in a factory :
Calculate: (i) the mean
(ii) the modal class
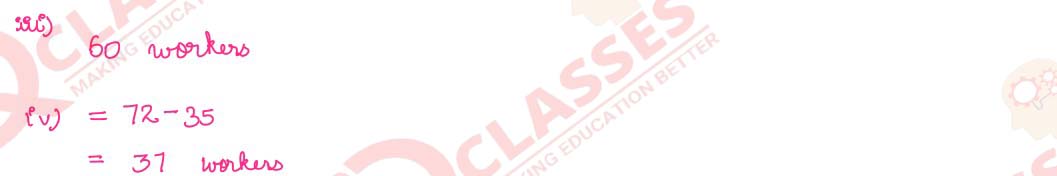
(iii) the number of workers getting weekly wages below Rs. 80
(iv) the number of workers getting Rs. 65 or more but less than Rs. 85 as weekly wages.
solutions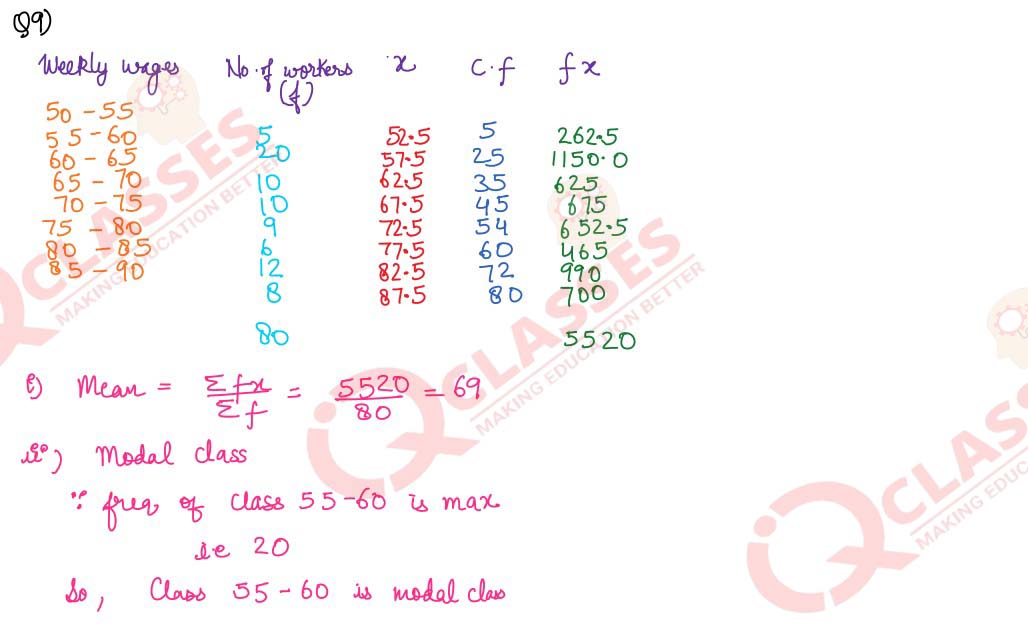
| Weekly wages in Rs. | 50-55 | 55-60 | 60-65 | 65-70 | 70-75 | 75-80 | 80-85 | 85-90 |
|---|---|---|---|---|---|---|---|---|
| Number of Workers | 5 | 20 | 10 | 10 | 9 | 6 | 12 | 8 |
Calculate: (i) the mean
(ii) the modal class
(iii) the number of workers getting weekly wages below Rs. 80
(iv) the number of workers getting Rs. 65 or more but less than Rs. 85 as weekly wages.
solutions


Reach Us
SERVICES
- ACADEMIC
- ON-LINE PREPARATION
- FOUNDATION & CRASH COURSES
CONTACT
B-54, Krishna Bhawan, Parag Narain Road,
Near Butler Palace Colony Lucknow
Contact:+918081967119
Add a comment